How to Build a Franchise Portal
Franchise businesses face some unique challenges. A huge part of this is gathering and managing information from independent locations.
Without an effective, centralized way to manage data, it’s almost impossible to achieve optimal performance or even full visibility across the business.
Today, we’re exploring one solution to this issue. We’re building a secure franchise portal for individual stores to share information with head office - and vice versa.
Specifically, we’re showing off how we can use Budibase to build fully functioning custom portals on top of just about any data source - with minimal custom code.
By the end, we’ll have a sleek, efficient platform where internal and external users can create, share, and manage sales reports, company announcements, and other key information - with appropriate access levels being granted to users based on their respective roles.
But first, let’s check out a little bit of background information.
What is a franchise portal?
At its core, a franchise portal is a gated platform where franchise managers and head office colleagues can carry out admin actions that are relevant to their roles within internal processes.
The most common tasks include submitting sales reports, analyzing performance, managing location data, or sharing announcements. Some more advanced portals might even include internal sales tools or inventory management features.
As with any portal solution, security is paramount.
In the first instance, this means that it should only be accessible by authenticated users. Besides this, we need effective access control tools to govern the specific data, features, and UIs that individual users can interact with.
With free SSO, extensive external data support, optional self-hosting, built-in RBAC, and more, Budibase is the ideal tool for building custom portals in a fraction of the time this would take with traditional development tools.
So…
What are we building?
We’re building a franchise portal for two distinct types of users.
- Basic users (franchise managers) will be able to submit sales reports, view their previous submissions, and receive company-wide announcements.
- Power users (head office staff) will be able to view and analyze sales figures and perform CRUD actions on location, announcement, or managers’ data.
We’ll achieve this by providing dedicated app screens for each class of user, tailoring their experiences to their specific needs.
With Budibase, we have the option of building custom portals on top of just about any business data.
Today, though, we’re using an existing PostgreSQL database.
We’ll also be making extensive use of Budibase’s autogenerated UIs, which give us a fast, flexible way to build app screens without extensive design skills.
Let’s jump in.
How to build a franchise portal in 6 steps
If you haven’t already, sign up to Budibase to start building as many custom portals as you want with our low-code platform - for free.
We’ll start by creating a new application. We have the option of using a pre-built template or importing an existing app dump, but today, we’re starting from scratch.
When we choose this option, we’re prompted to give our app a name and URL slug.
We’re going to call ours Franchise Portal.

1. Setting up our data model
Once we’ve done that, we’re offered a range of choices for the data we’d like to connect our app to.
Budibase offers dedicated connectors for querying relational databases, NoSQL tools, APIs, and Google Sheets - alongside our built-in low-code database.
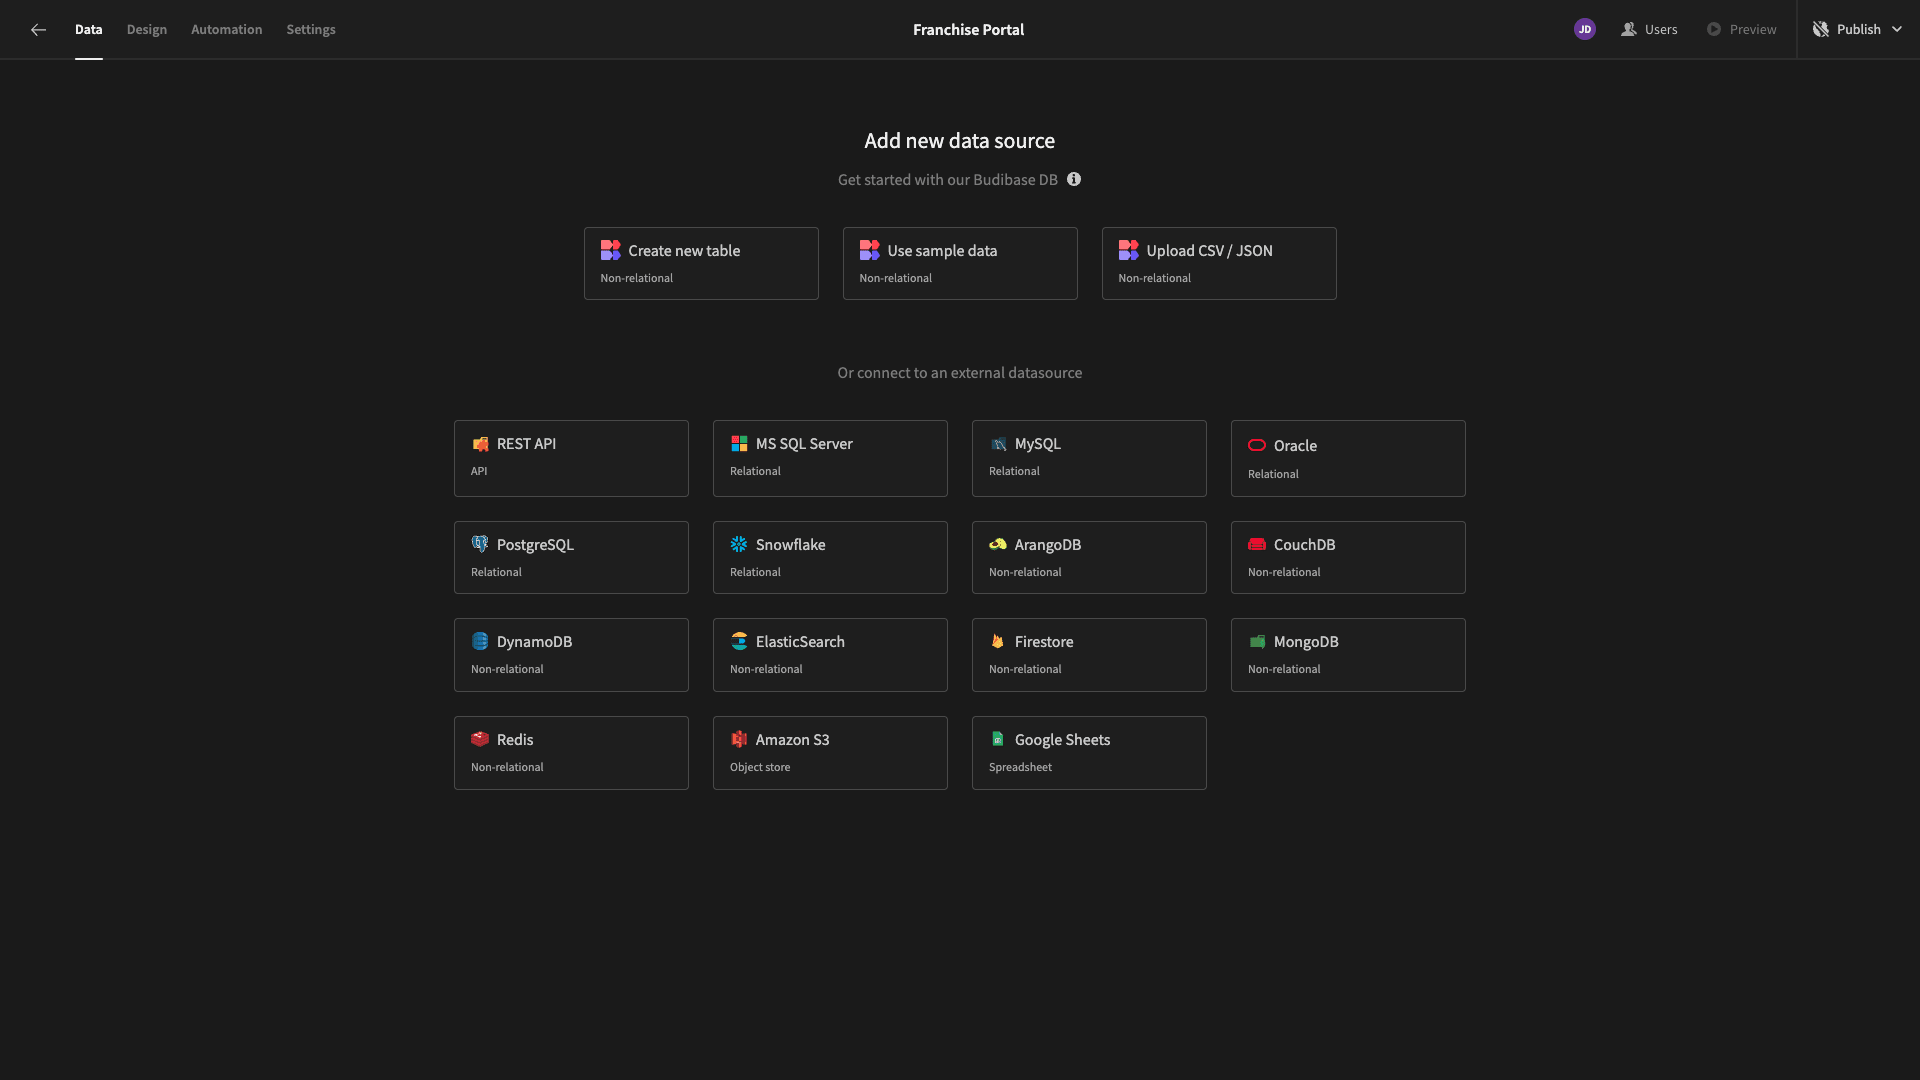
As we said a moment ago, we’re going to build our franchise portal on top of an existing Postgres database. We’ll provide the queries to create this in a second.
When we select this option, we’re prompted to input our configuration details.

We can enter these manually or use database credentials that we’ve stored as secure environment variables within Budibase.
Next, we can choose which of our database’s constituent tables we want to fetch, making them queryable within Budibase. Our database contains four tables, called announcements, locations, managers, and sales_reports.
We’re fetching all four.
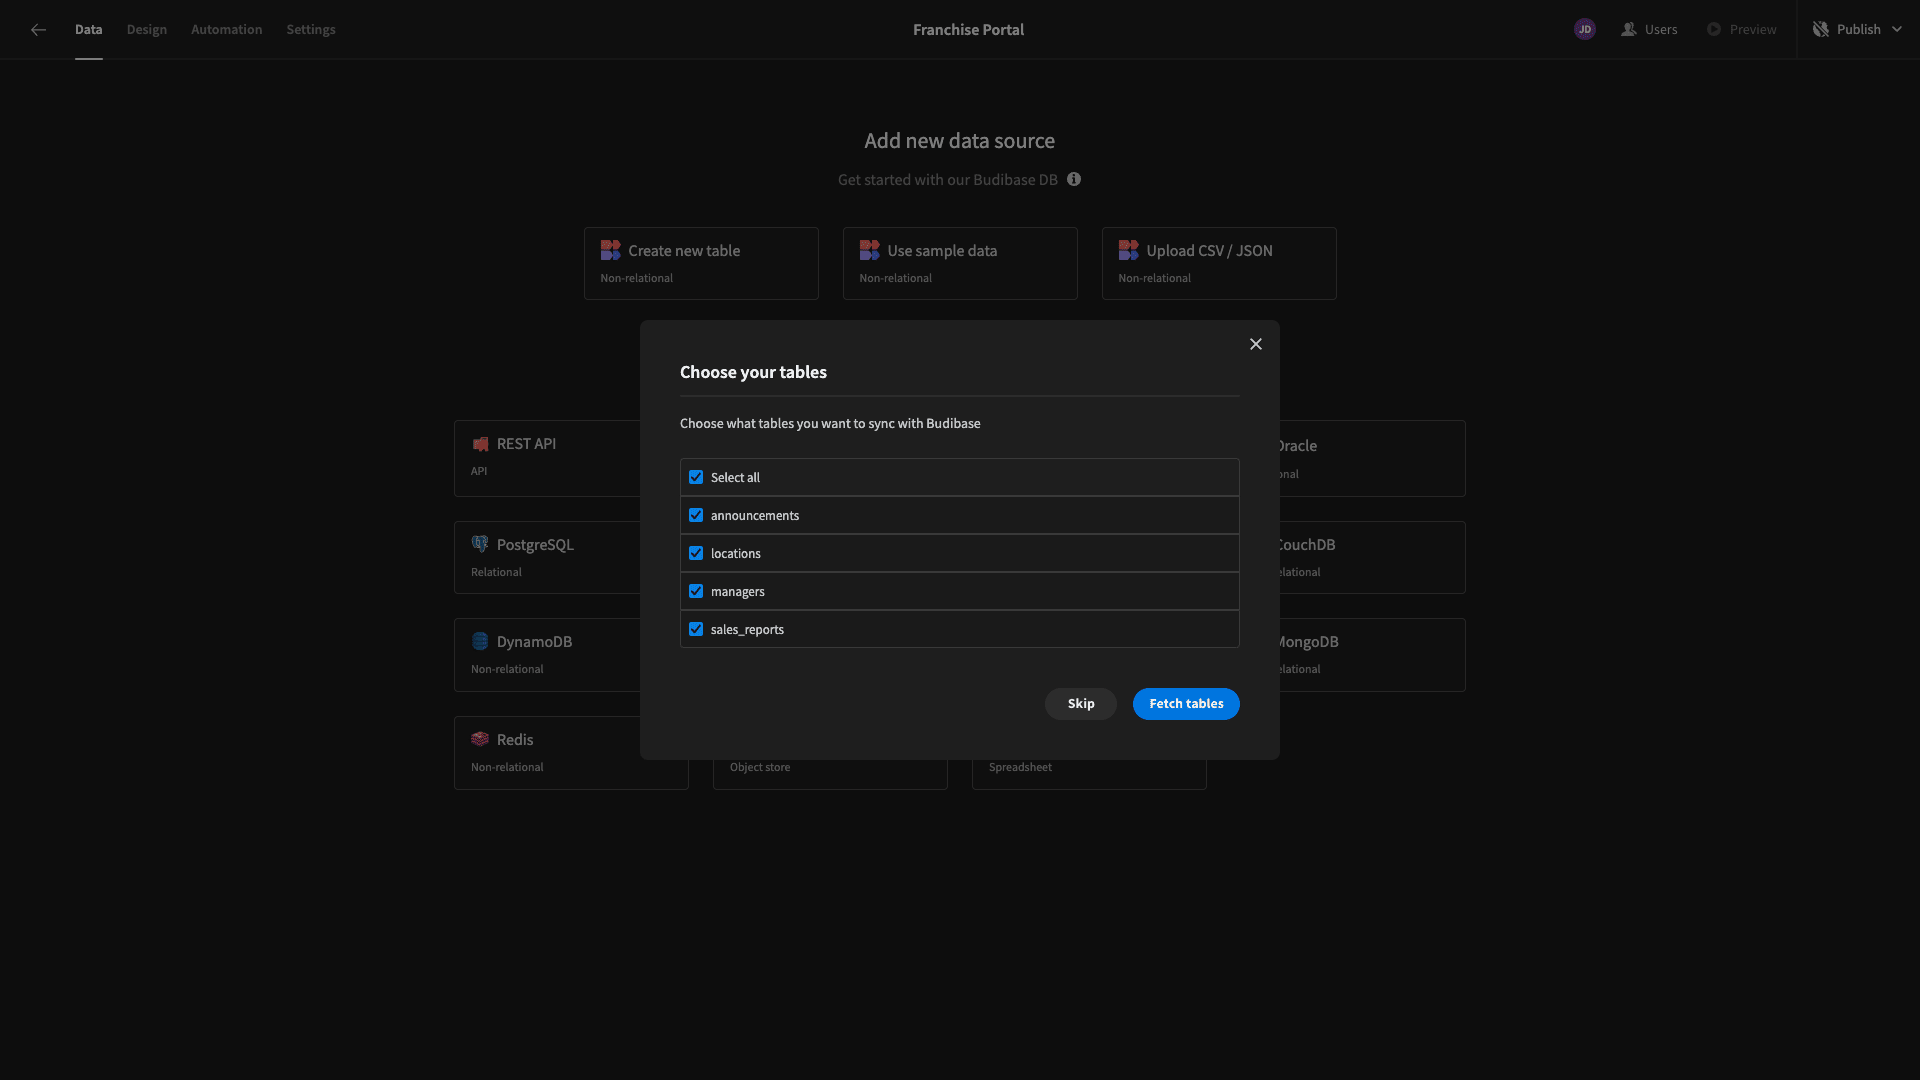
Here’s what the announcements table will look like in Budibase’s Data section.

Already, we alter the schema or stored values using Budibase’s spreadsheet-like UI.
This table contains attributes called title, message, announcement_date, and announcement_id.
We can create and populate it with the following query.
 1CREATE TABLE announcements (
 2
 3  announcement_id SERIAL PRIMARY KEY,
 4
 5  title VARCHAR(255),
 6
 7  message TEXT,
 8
 9  announcement_date DATE
10
11);
12
13INSERT INTO announcements (title, message, announcement_date) VALUES
14
15('Important Update', 'Lorem ipsum dolor sit amet, consectetur adipiscing elit.', '2024-03-25'),
16
17('New Feature Announcement', 'Nulla facilisi. Ut accumsan tortor vel libero placerat, nec malesuada nisl ullamcorper.', '2024-03-26'),
18
19('Upcoming Maintenance', 'Vestibulum ante ipsum primis in faucibus orci luctus et ultrices posuere cubilia Curae.', '2024-03-27');
Next, we have the managers table. It contains columns called manager_id, manager_name, email, phone, and location_id.
 1CREATE TABLE managers (
 2
 3  manager_id SERIAL PRIMARY KEY,
 4
 5  manager_name VARCHAR(100),
 6
 7  email VARCHAR(100),
 8
 9  phone VARCHAR(15),
10
11  location_id INT REFERENCES locations(location_id)
12
13);
14
15INSERT INTO managers (manager_name, email, phone, location_id)
16
17VALUES
18
19  ('John Smith', 'john@example.com', '123-456-7890', 1),
20
21  ('Jane Doe', 'jane@example.com', '987-654-3210', 2),
22
23  ('Bob Johnson', 'bob@example.com', '111-222-3333', 3);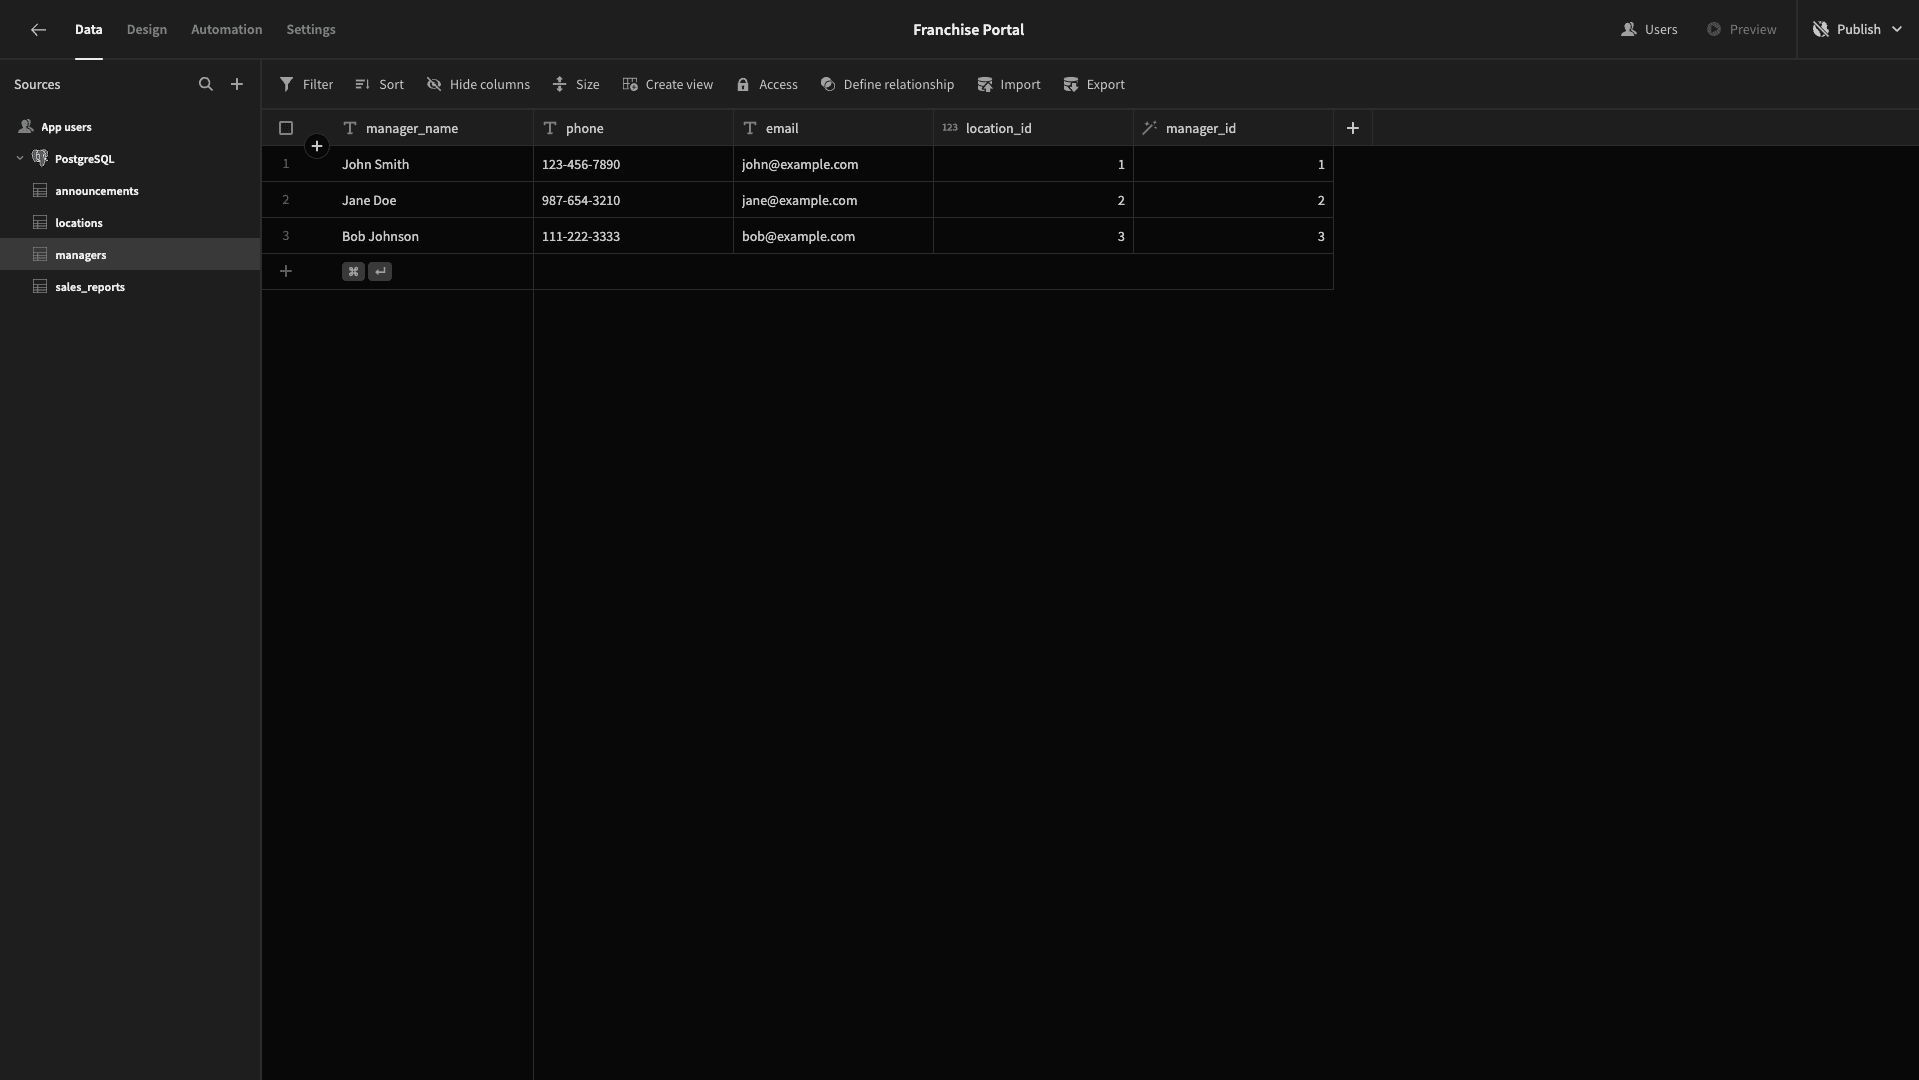
The locations table stores attributes called location_name, location_id, address, city, state, country, and postal_code.
We can create it with this query:
 1-- Create the table
 2
 3CREATE TABLE locations (
 4
 5  state VARCHAR(2),
 6
 7  location_name VARCHAR(100),
 8
 9  country VARCHAR(100),
10
11  address VARCHAR(255),
12
13  location_id SERIAL PRIMARY KEY,
14
15  city VARCHAR(100),
16
17  postal_code VARCHAR(20)
18
19);
20
21-- Populate the table
22
23INSERT INTO locations (state, location_name, country, address, city, postal_code)
24
25VALUES
26
27  ('CA', 'Main Street Store', 'USA', '123 Main St', 'Anytown', '12345'),
28
29  ('NY', 'Downtown Outlet', 'USA', '456 Elm St', 'Downtown', '54321'),
30
31  ('TX', 'Suburban Mall', 'USA', '789 Oak St', 'Suburbia', '67890');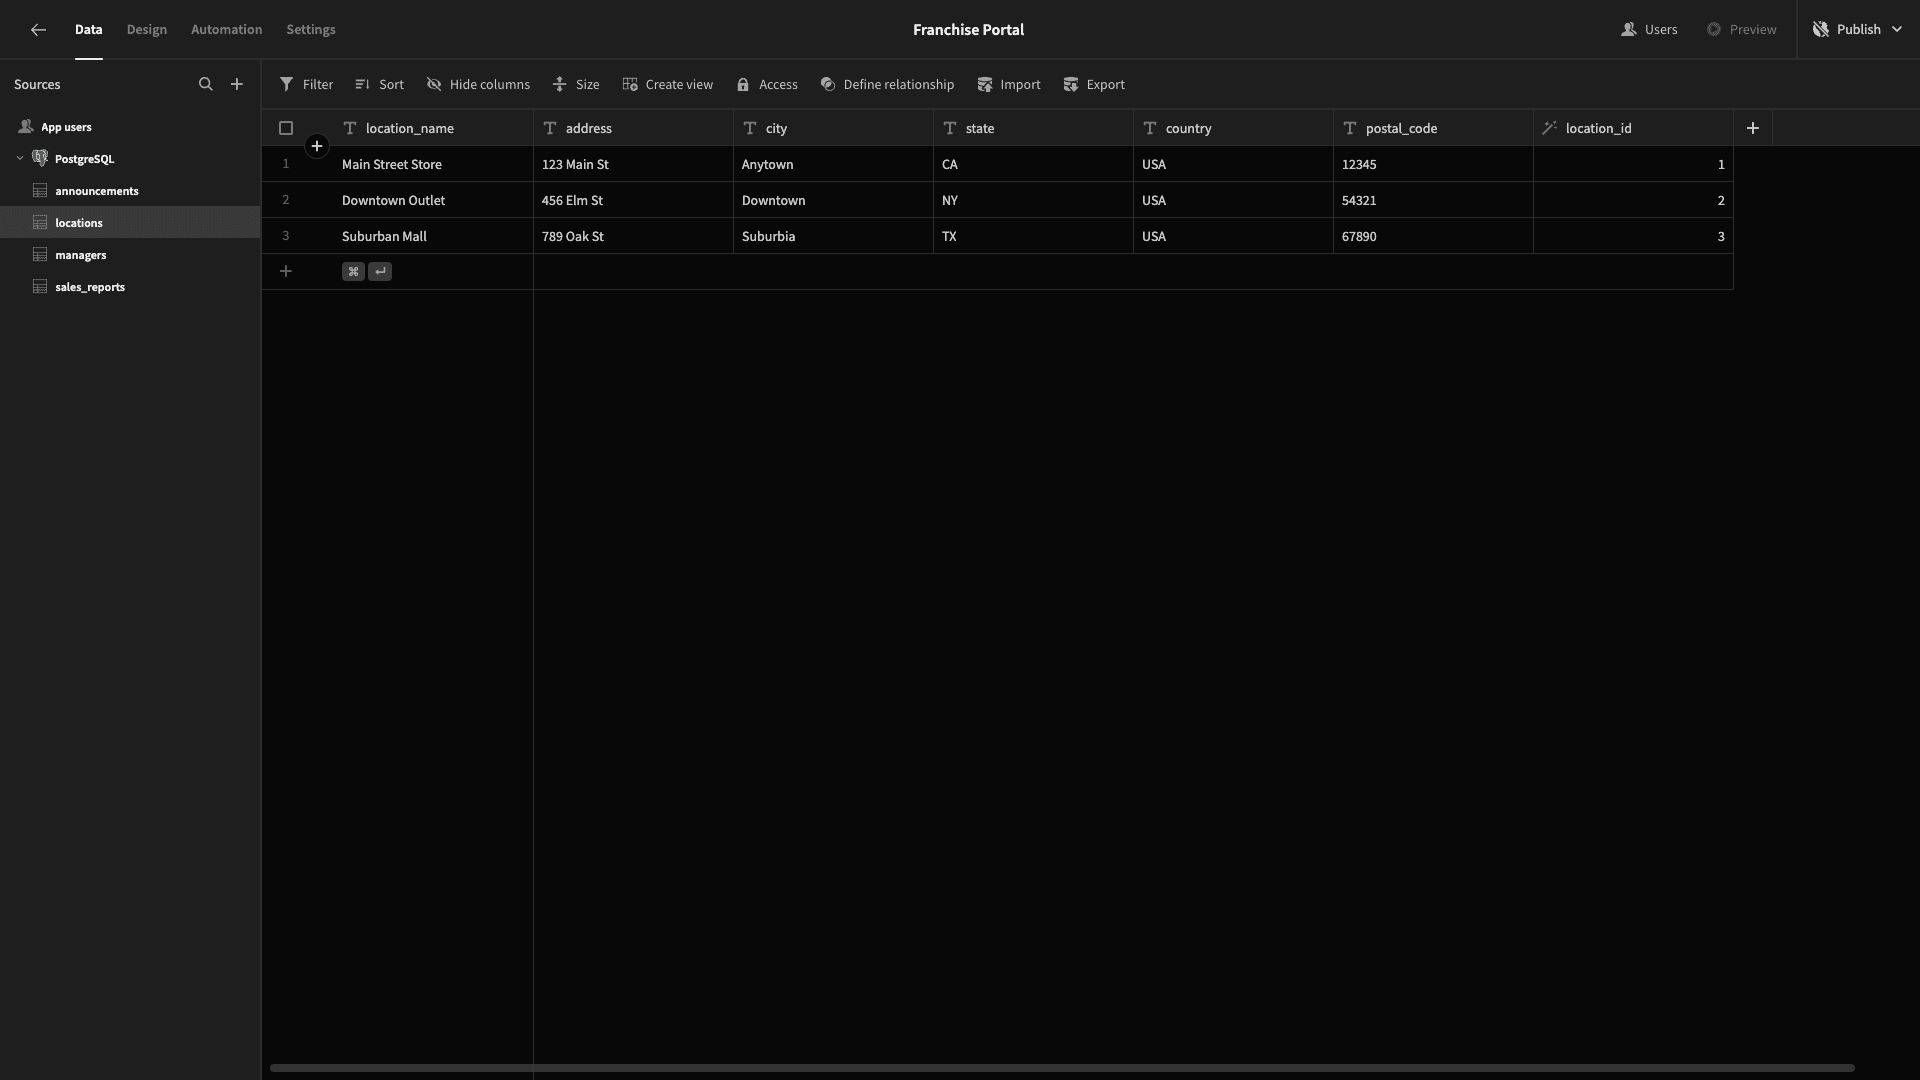
Lastly, the columns in our sales_reports table are report_id, items_sold, report_date, week_of_year, num_transactions, location_id, total_sales, and manager_id.
 1-- Create the table
 2
 3CREATE TABLE sales_reports (
 4
 5  report_id INT,
 6
 7  items_sold INT,
 8
 9  report_date TIMESTAMP,
10
11  week_of_year INT,
12
13  num_transactions INT,
14
15  location_id INT,
16
17  total_sales NUMERIC(10, 2),
18
19  manager_id INT,
20
21  PRIMARY KEY (report_id)
22
23);
24
25-- Populate the table
26
27INSERT INTO sales_reports (report_id, items_sold, report_date, week_of_year, num_transactions, location_id, total_sales, manager_id)
28
29VALUES
30
31  (1, 100, '2024-01-01', 1, 50, 1, 1500.00, 1),
32
33  (3, 140, '2024-01-01', 1, 70, 3, 2500.00, 3),
34
35  (2, 120, '2024-01-01', 1, 60, 2, 2000.00, 2),
36
37  (5, 120, '2024-01-01', 1, 60, 2, 2000.00, 2),
38
39  (6, 140, '2024-01-01', 1, 70, 3, 2500.00, 3),
40
41  (7, 15, '2024-04-02', 13, 10, 3, 1500.00, 3),
42
43  (4, 100, '2024-01-01', 1, 50, 1, 1500.00, 1),
44
45  (8, 160, '2024-02-05', 6, 80, 1, 2200.00, 1),
46
47  (9, 180, '2024-02-05', 6, 90, 2, 2600.00, 2),
48
49  (10, 200, '2024-02-05', 6, 100, 3, 3100.00, 3),
50
51  (11, 170, '2024-02-12', 7, 85, 1, 2300.00, 1),
52
53  (12, 190, '2024-02-12', 7, 95, 2, 2700.00, 2),
54
55  (13, 210, '2024-02-12', 7, 105, 3, 3200.00, 3),
56
57  (14, 180, '2024-02-19', 8, 90, 1, 2400.00, 1),
58
59  (15, 200, '2024-02-19', 8, 100, 2, 2800.00, 2),
60
61  (16, 220, '2024-02-19', 8, 110, 3, 3300.00, 3),
62
63  (17, 190, '2024-02-26', 9, 95, 1, 2500.00, 1),
64
65  (18, 210, '2024-02-26', 9, 105, 2, 2900.00, 2),
66
67  (19, 230, '2024-02-26', 9, 115, 3, 3400.00, 3),
68
69  (20, 200, '2024-03-04', 10, 100, 1, 2600.00, 1),
70
71  (21, 220, '2024-03-04', 10, 110, 2, 3000.00, 2),
72
73  (22, 240, '2024-03-04', 10, 120, 3, 3500.00, 3);
Before we start building our franchise portal’s UIs, we’re going to make a few minor adjustments to our data model.
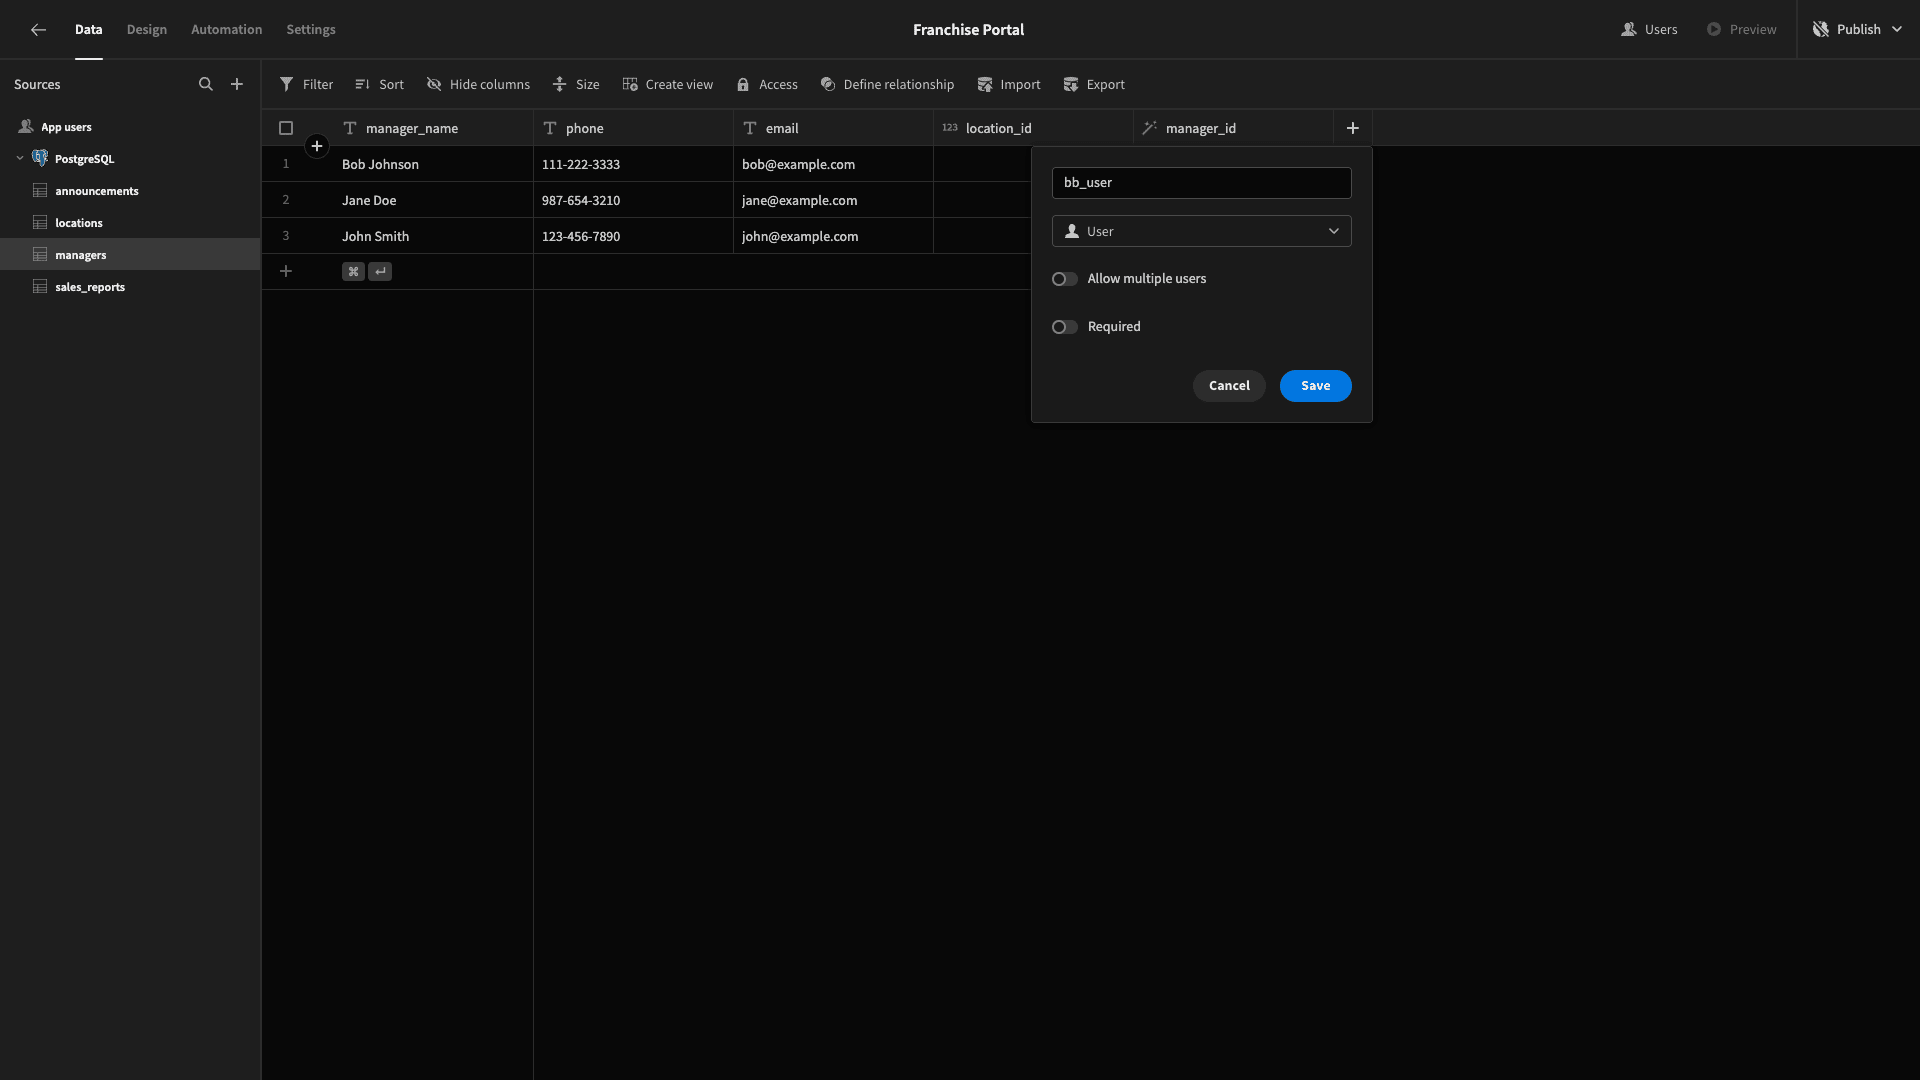
First of all, we need a way to link entries in our managers table to our users.
Budibase offers a special data type for doing this within internal or SQL tables. So, we’ll head to our managers table and add a column using the plus icon. We’re selecting the User type and calling our new column bb_user.
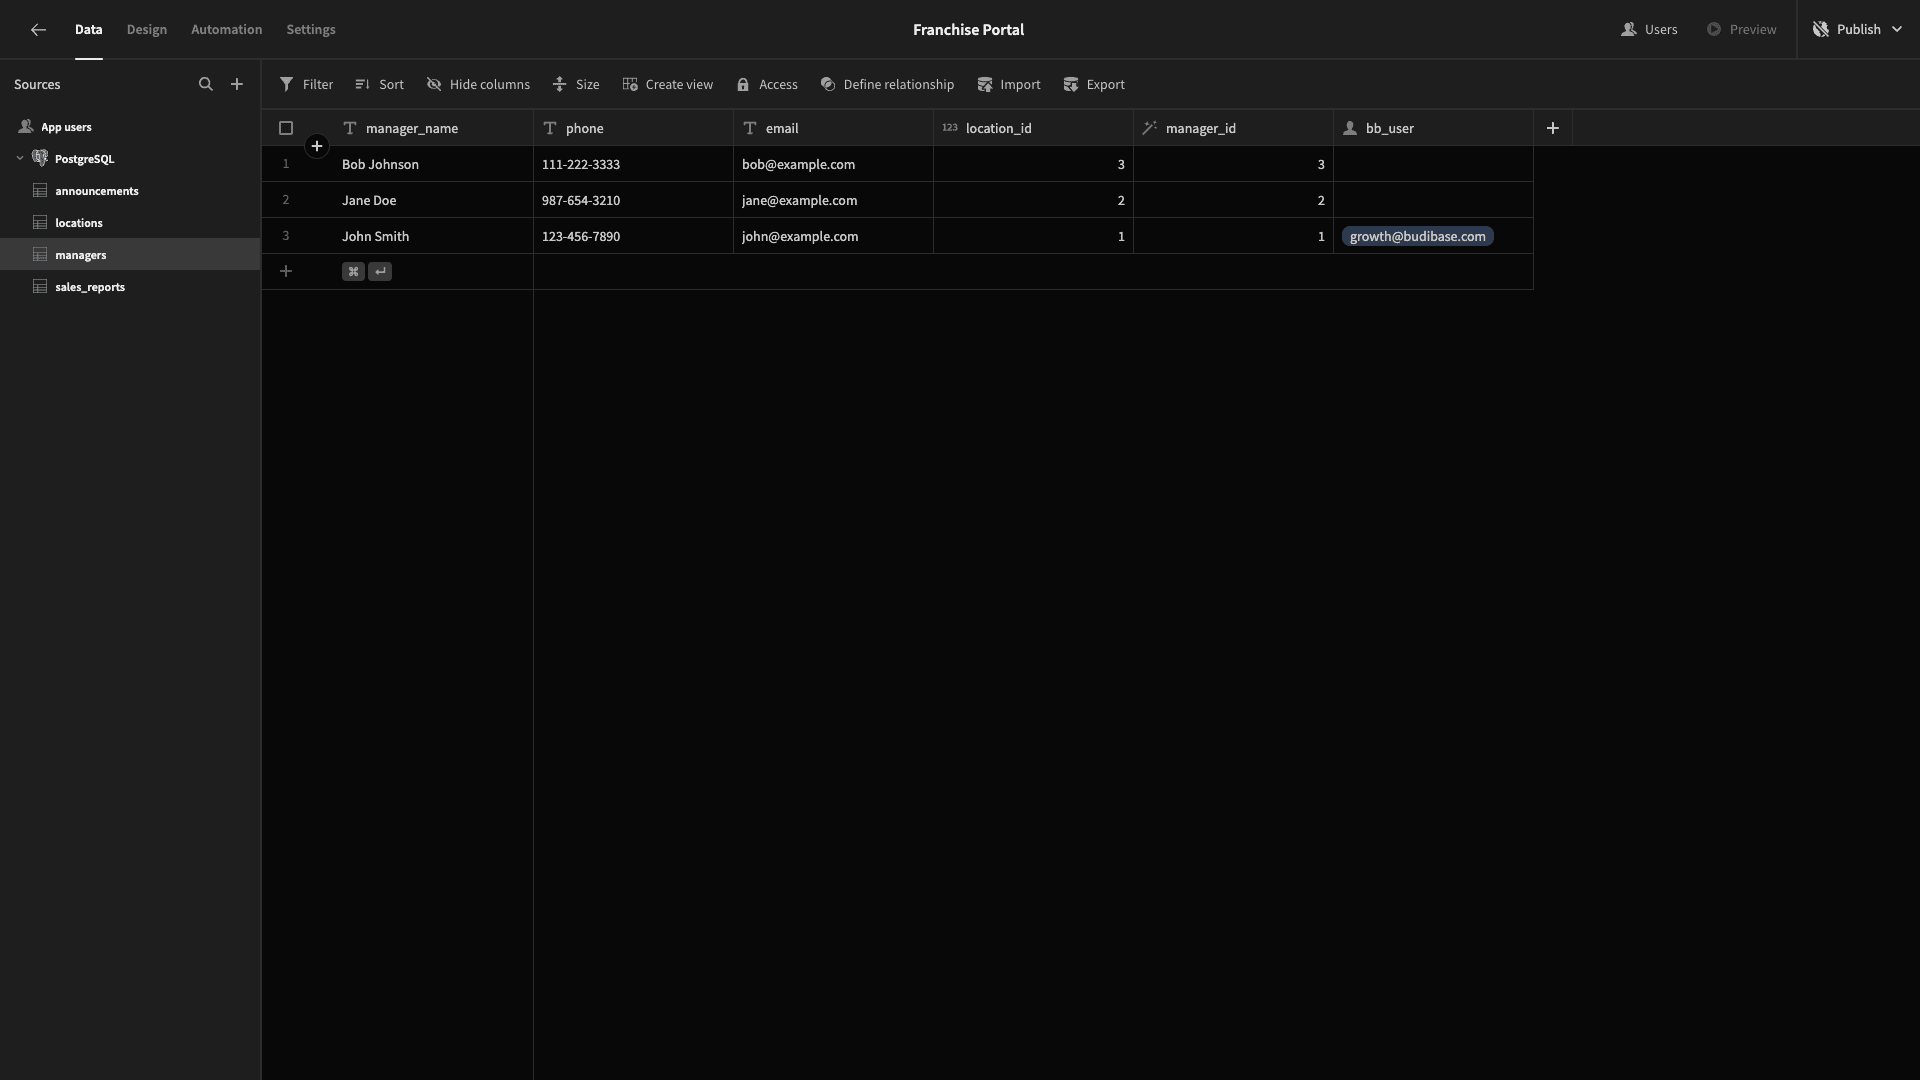
We’ll then assign ourselves to one of these rows for testing purposes.
Next, our announcements table contains an attribute called description that could potentially be used to input or present quite a long piece of copy. Currently though, this has the Text Type.
We’re changing this to Long-Form Text so that appropriate fields are provided when we autogenerate our form UIs a little later.

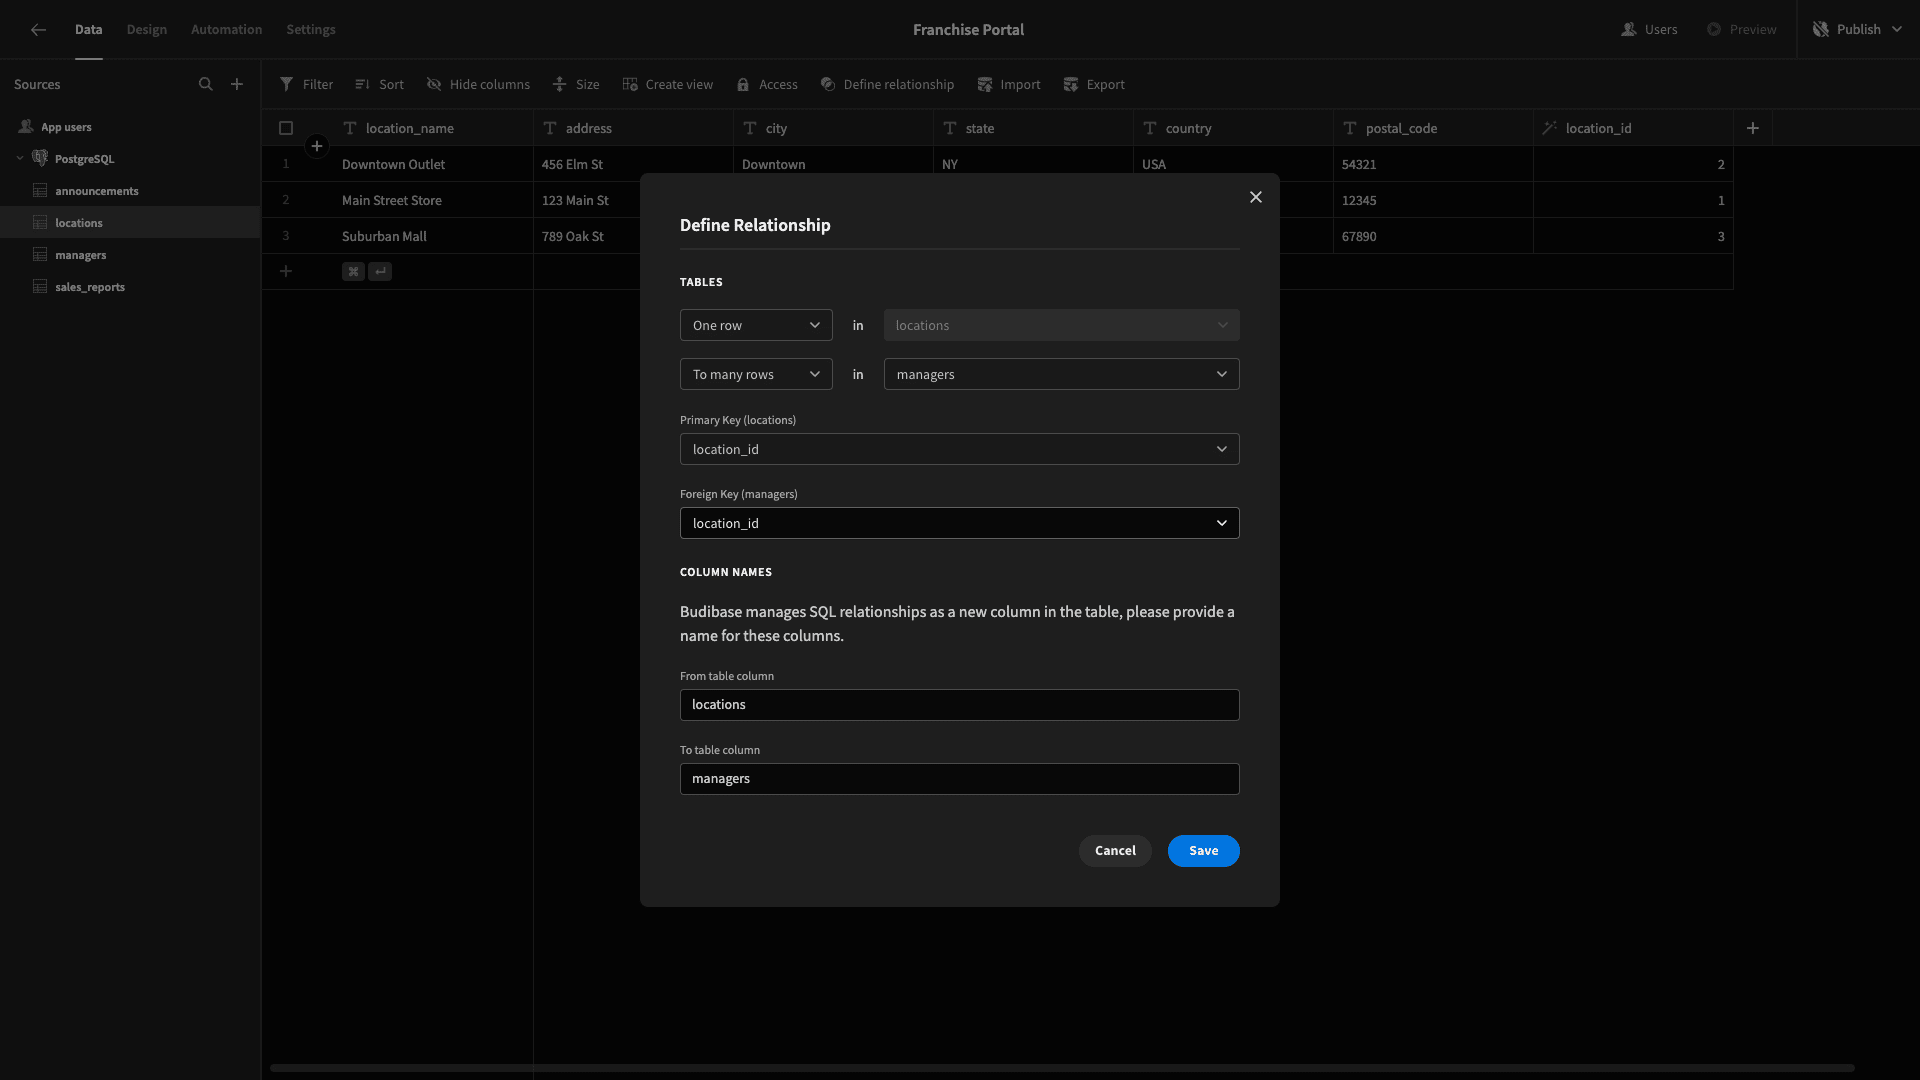
Lastly, we need to define how our tables relate to one another. Several of our tables contain attributes that reference the ID columns of other tables.
We can hit the Define Relationships button to map out how this works.
First, we’ll link one row in the locations table to the mangagers table using the location_id in each.
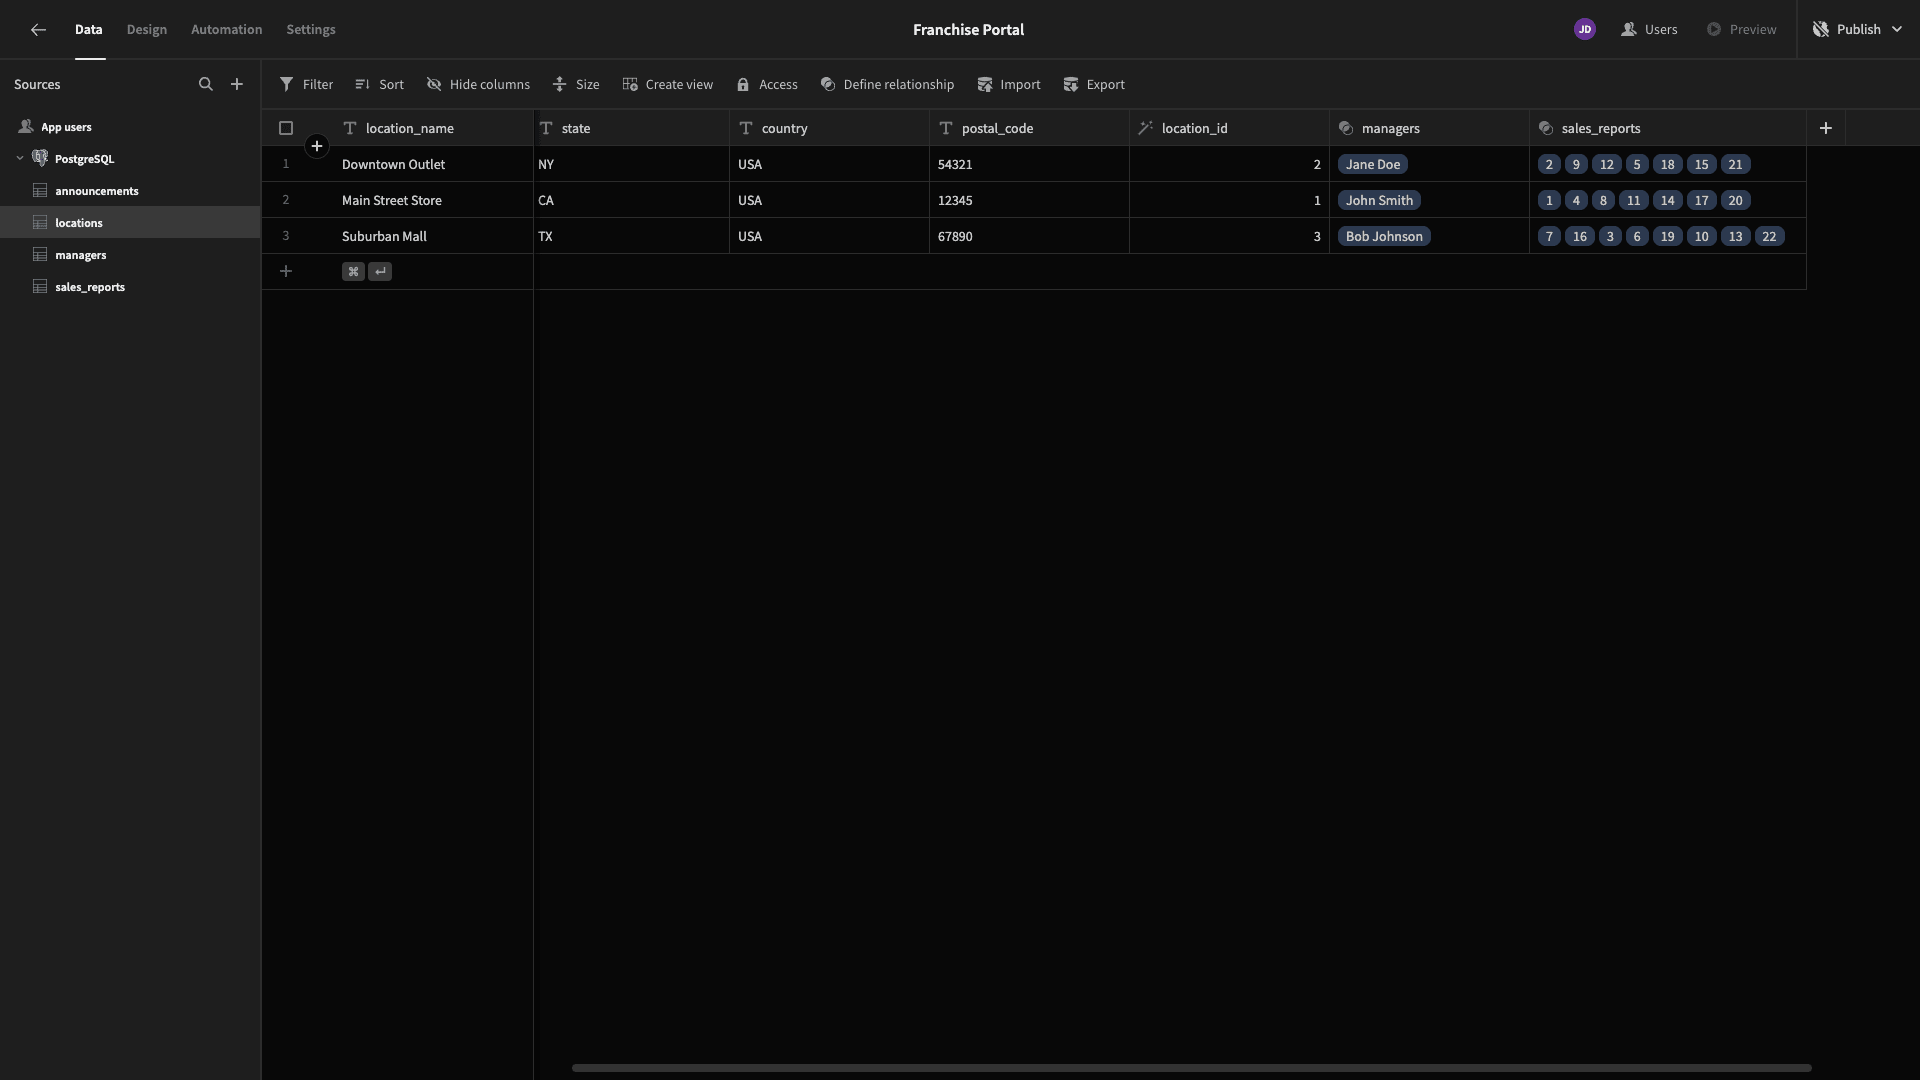
Then, we’ll repeat this process to link the locations table to the sales_reports table on the same attribute.

Now, we can see the related rows within our locations table.
Lastly, we’ll link one row in our managers table to many rows in the sales_reports table using the manager_id attribute.

Now, we’re ready to start building our franchise portal’s UIs.
2. Building our reporting screen
First of all, we want to build a screen where franchise managers will be able to submit their sales reports or view their previous submissions.
Head to the Design tab, and we’re prompted with several options for how we want to create our first screen - including using one of Budibase’s autogenerated layouts.
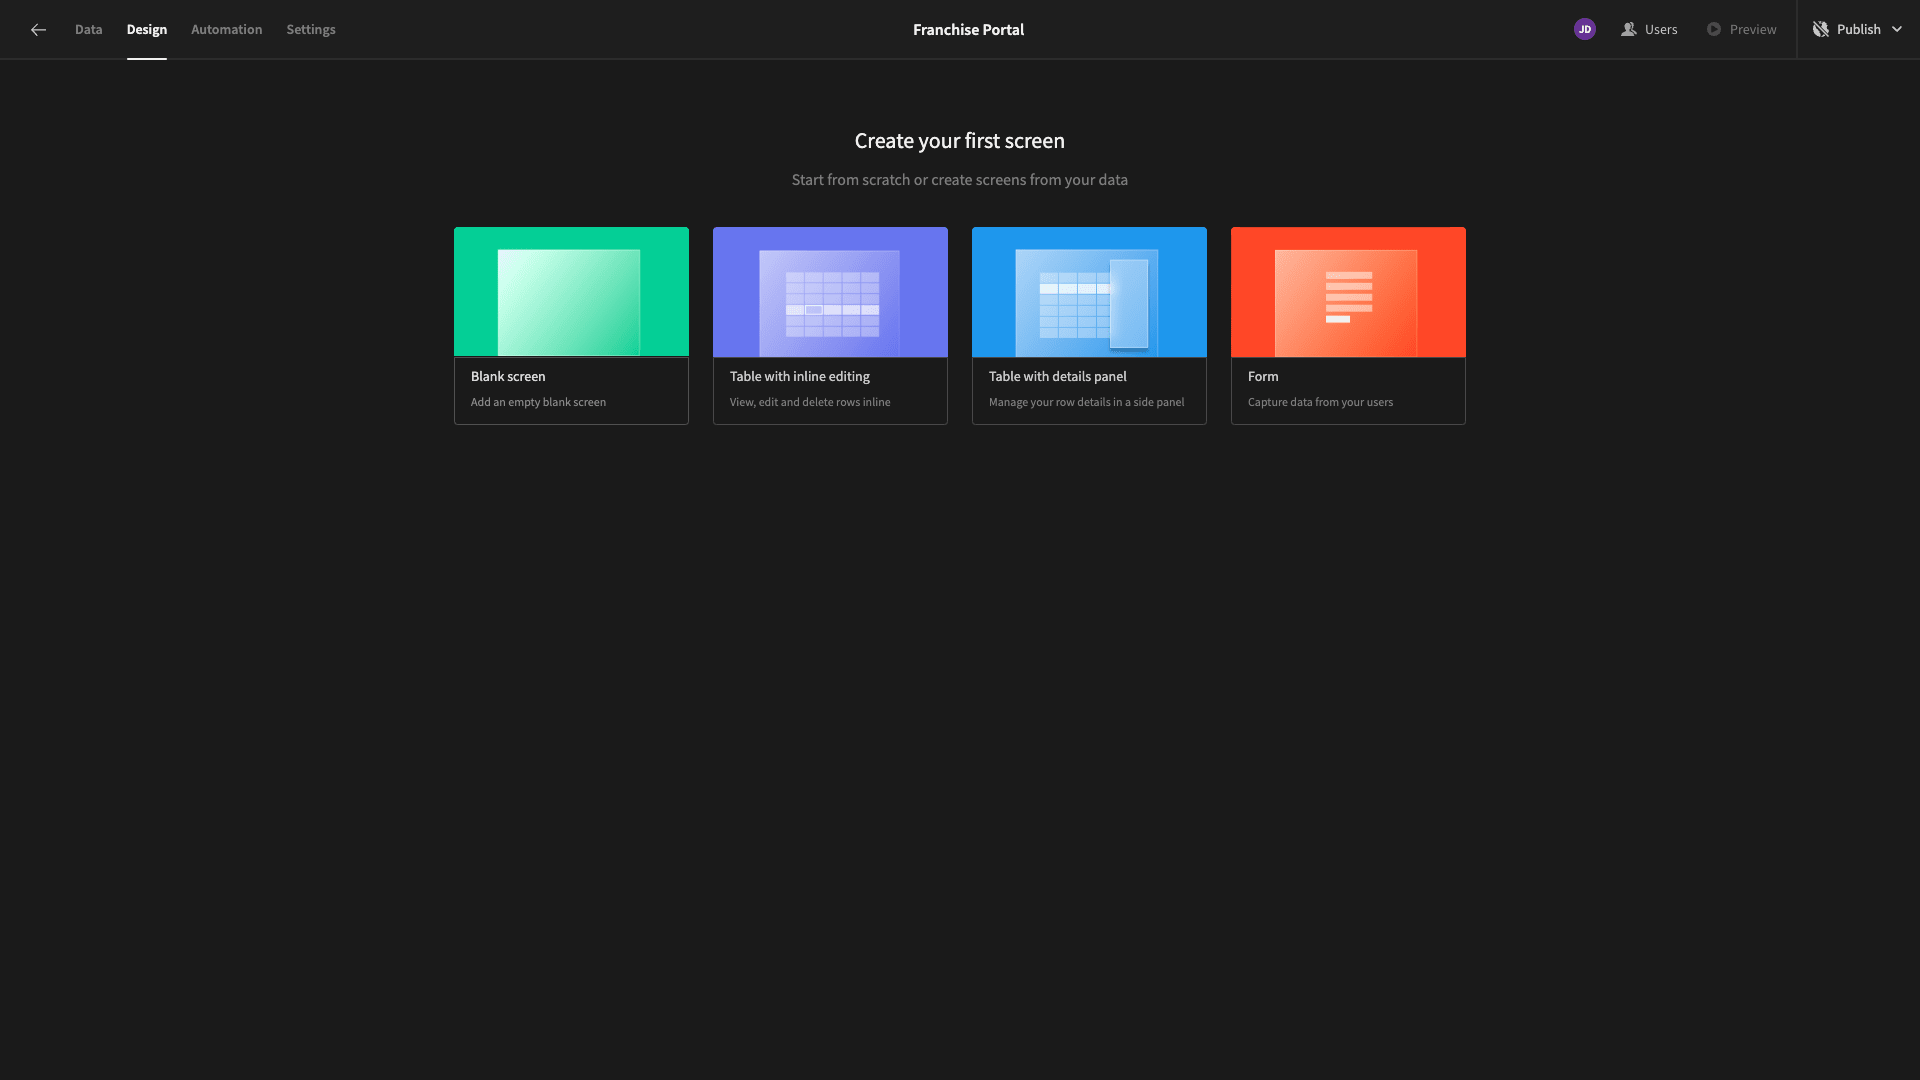
We’re going to use a layout called Table with Details Panel. This will generate a working CRUD UI based on whichever table we point it at.
We’re choosing sales_reports.

Then, we need to choose a minimum role that will be required to access this screen. We’re leaving this set to the default option of Basic.
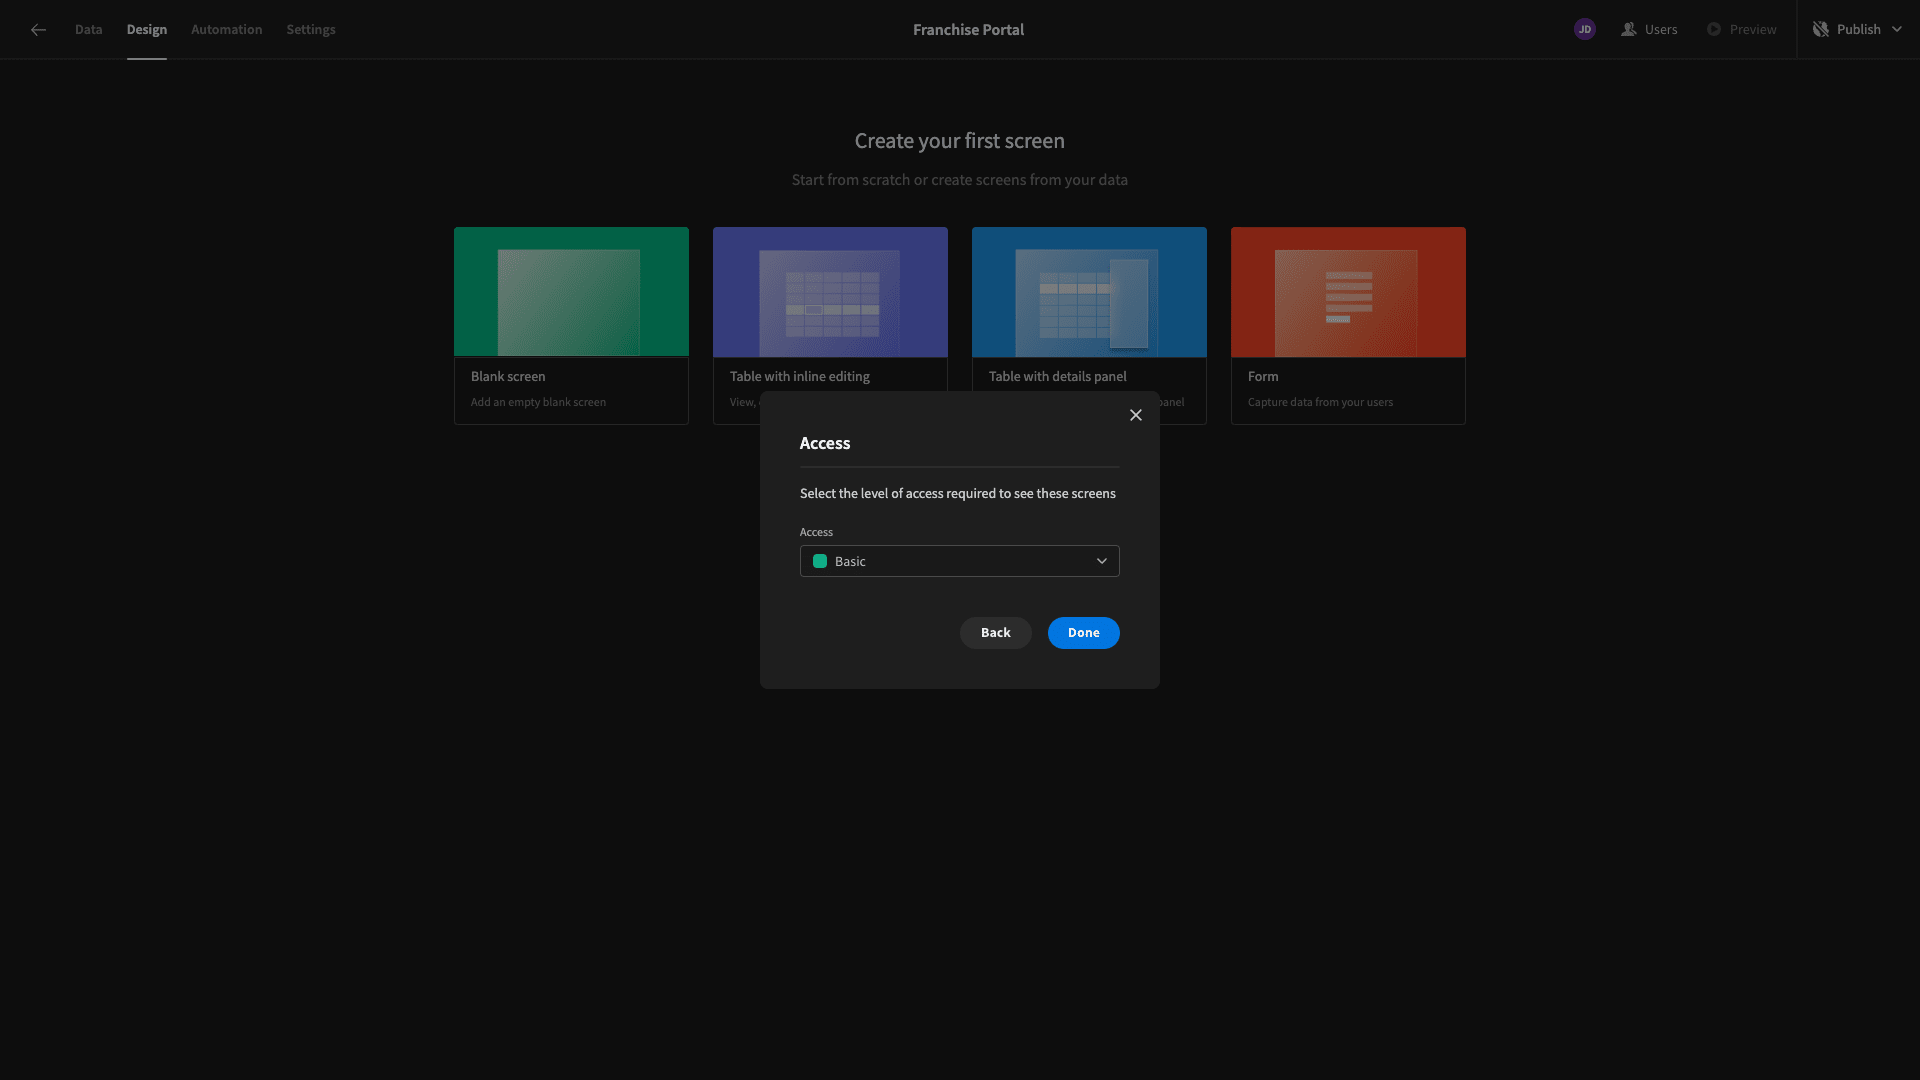
Our new screen is centered around a table that displays all of our sales_reports rows.

We can also access forms to create or update rows within side panels.

We’re going to make quite a few changes to this to better suit our purposes.
First of all, we don’t want to expose our franchise managers to all of the data stored in our sales_reports table. Rather, each one should only be able to access the reports that relate to their own location.
We can apply a filter to achieve this. But our table can’t currently access the data we need to create our filter.
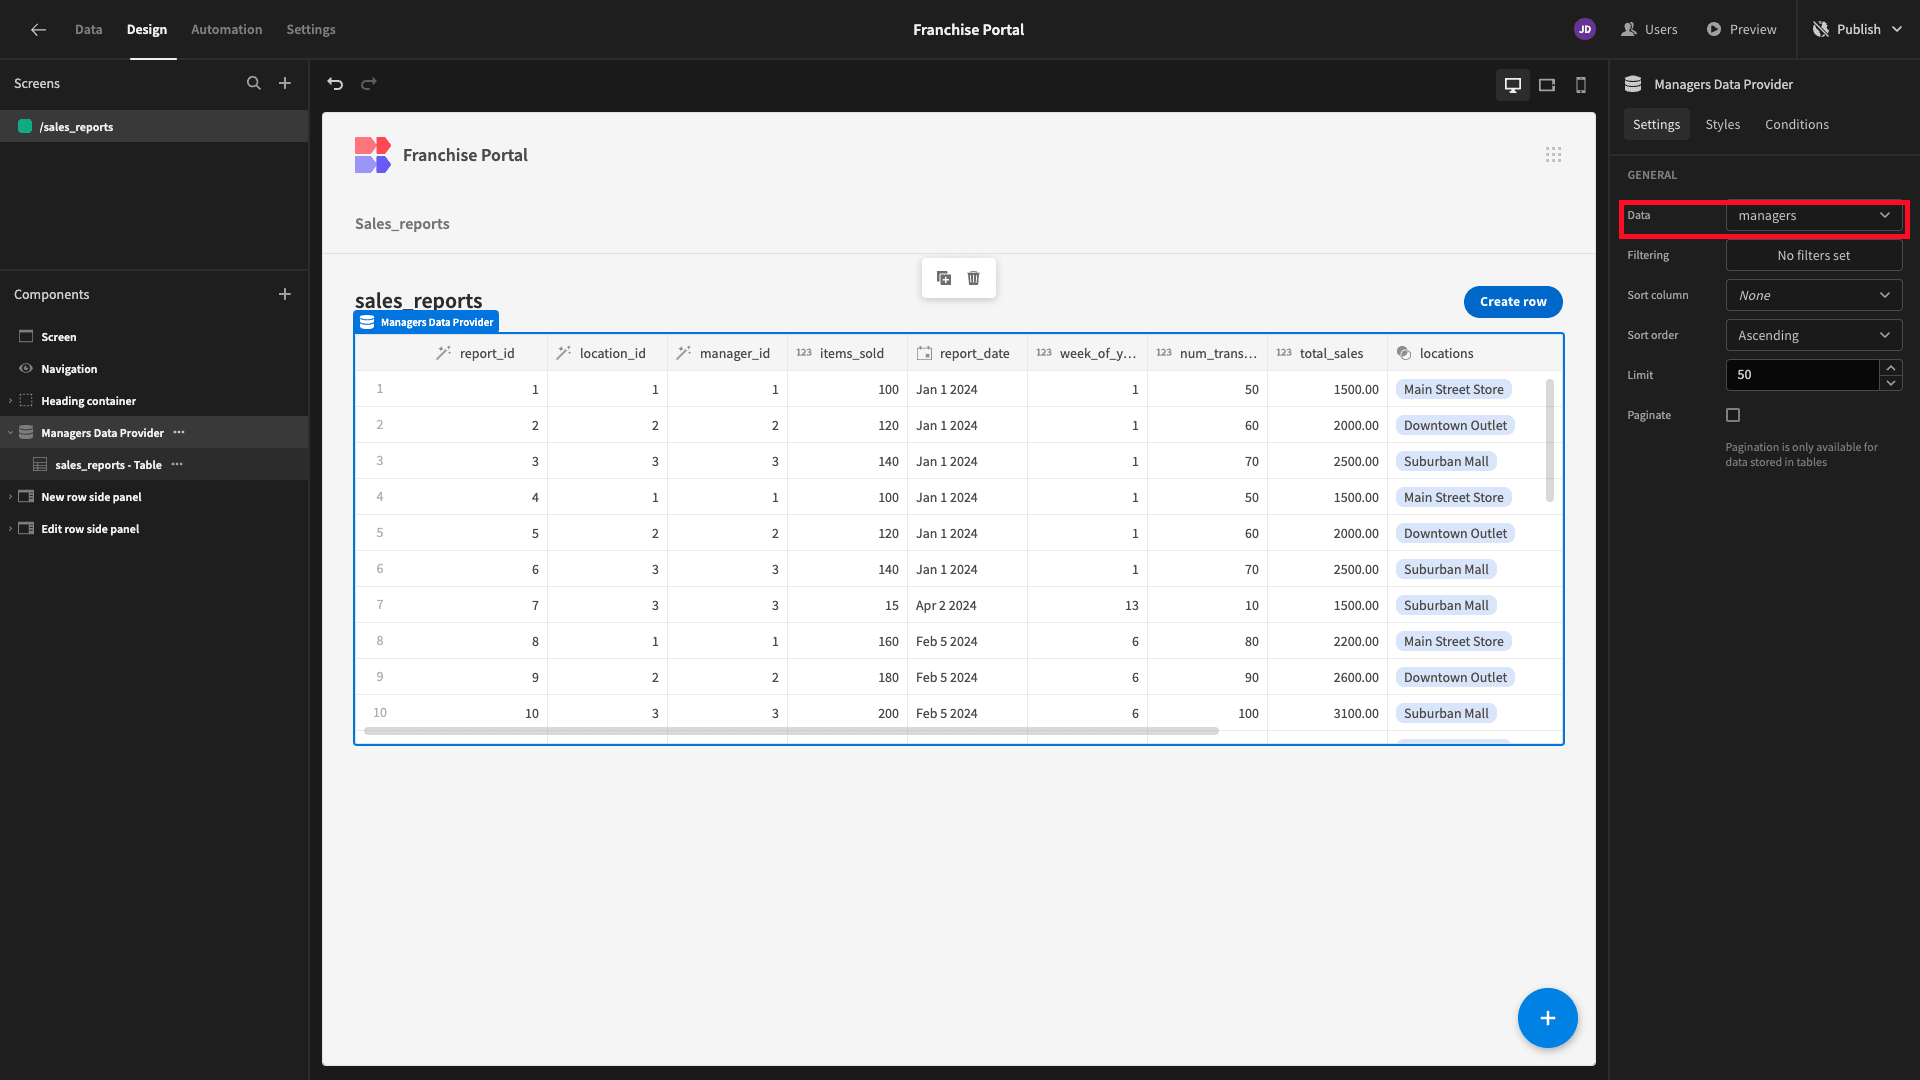
So, we’re going to add a component called Data Provider and nest our table within this.

This accepts a data source and exposes other components on the screen to information stored within.
We’re going to point ours at the managers table. We’ve also given it a more descriptive component name.
Next, we’ll add a filter to our Data Provider. We’re creating a rule based on the bb_user attribute in our managers table.
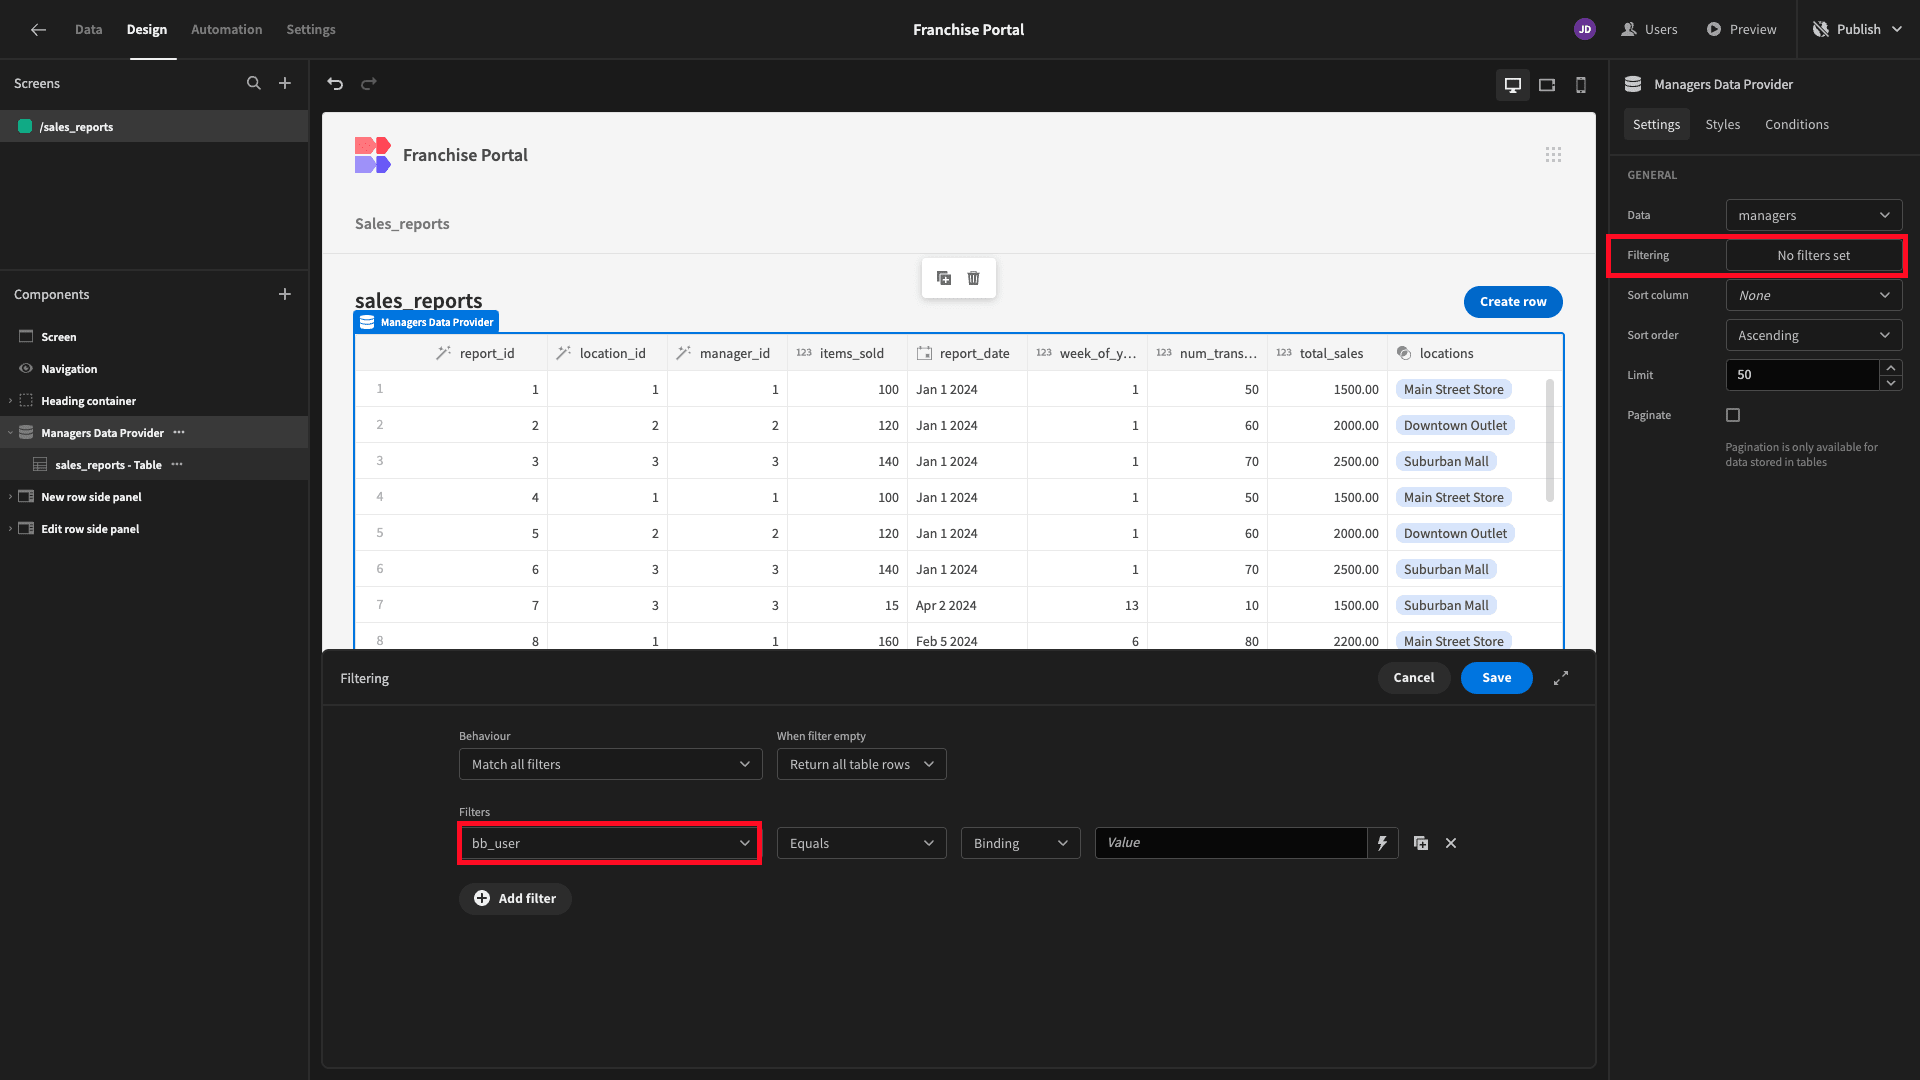
We’ll use the lightning bolt icon next to the Value setting to open our bindings drawer.
Here, we can access all of the categories of data that our component is exposed to. We’ll click on Current User.

And we want to bind our value to their _id attribute.

Next, we want to filter our Table component by the row that our Data Provider outputs.
We’ll start by creating a rule based on the manager_id attribute in our sales_reports table.
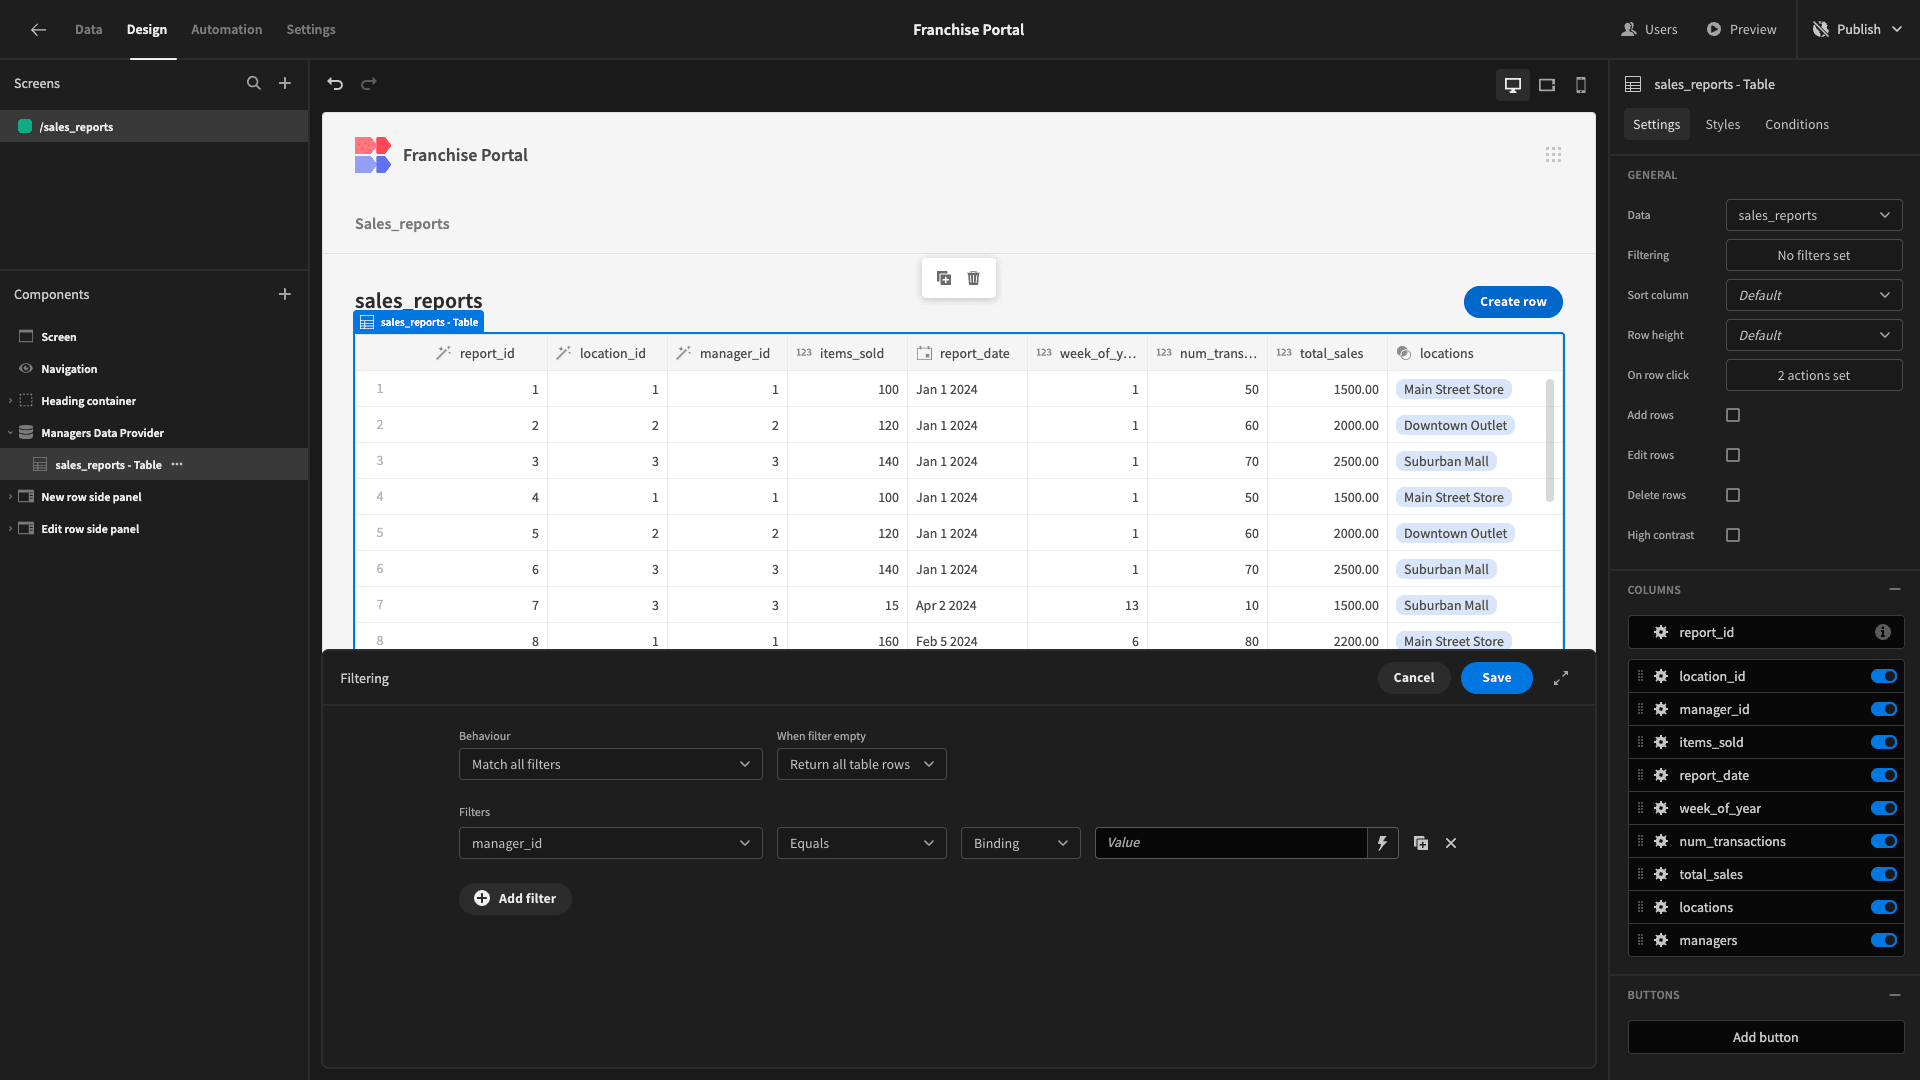
Then in the bindings menu, we’re choosing our Data Provider.
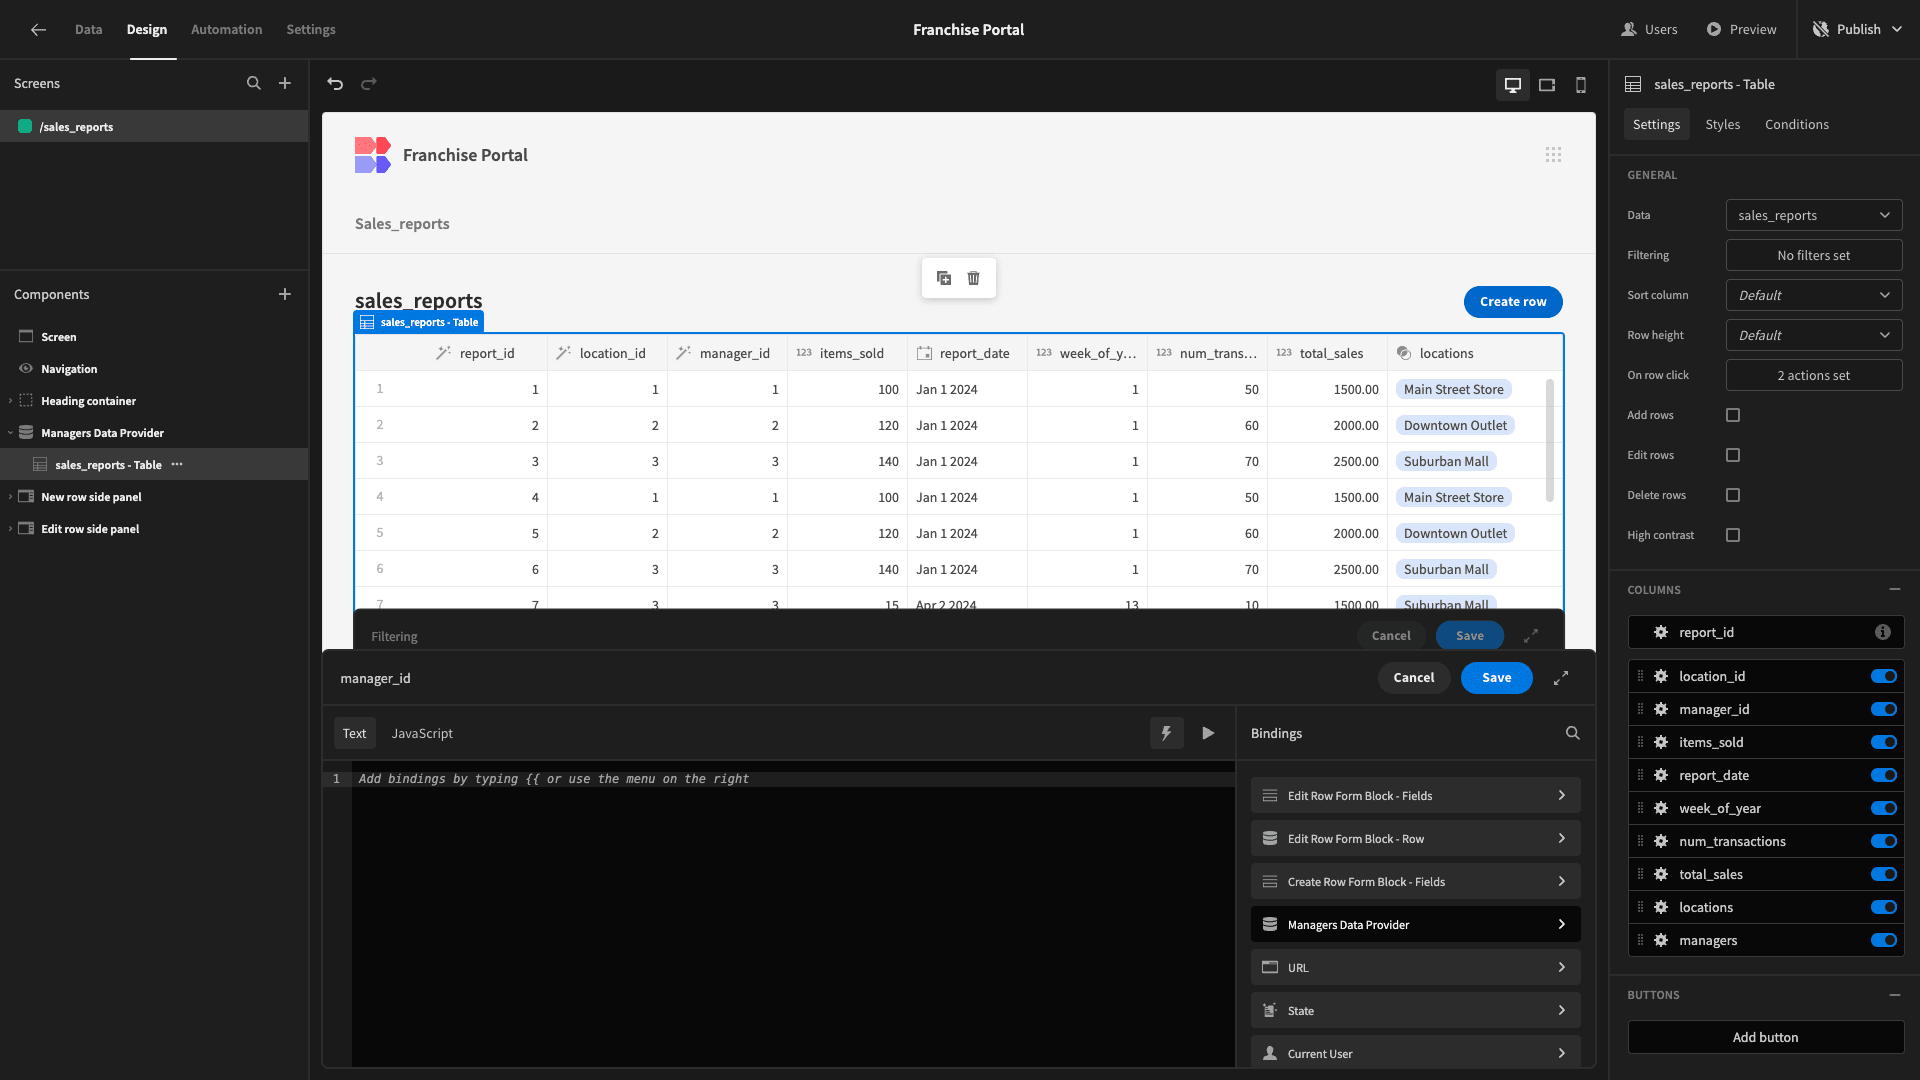
The binding we want is called Rows.

However, the syntax for using a bindable value from a Data Provider is a little bit different - because these will usually output multiple rows. So, we need to provide an index when we’re writing our binding.
Because of our filter, ours will only output a single row, so our index will always be 0, and we can provide the specific attribute name after this. Therefore, our binding is {{ Managers Data Provider.Rows.0.manager_id }}.

Now, we can only see the rows that relate to the managers entry that we assigned our Budibase account to earlier.
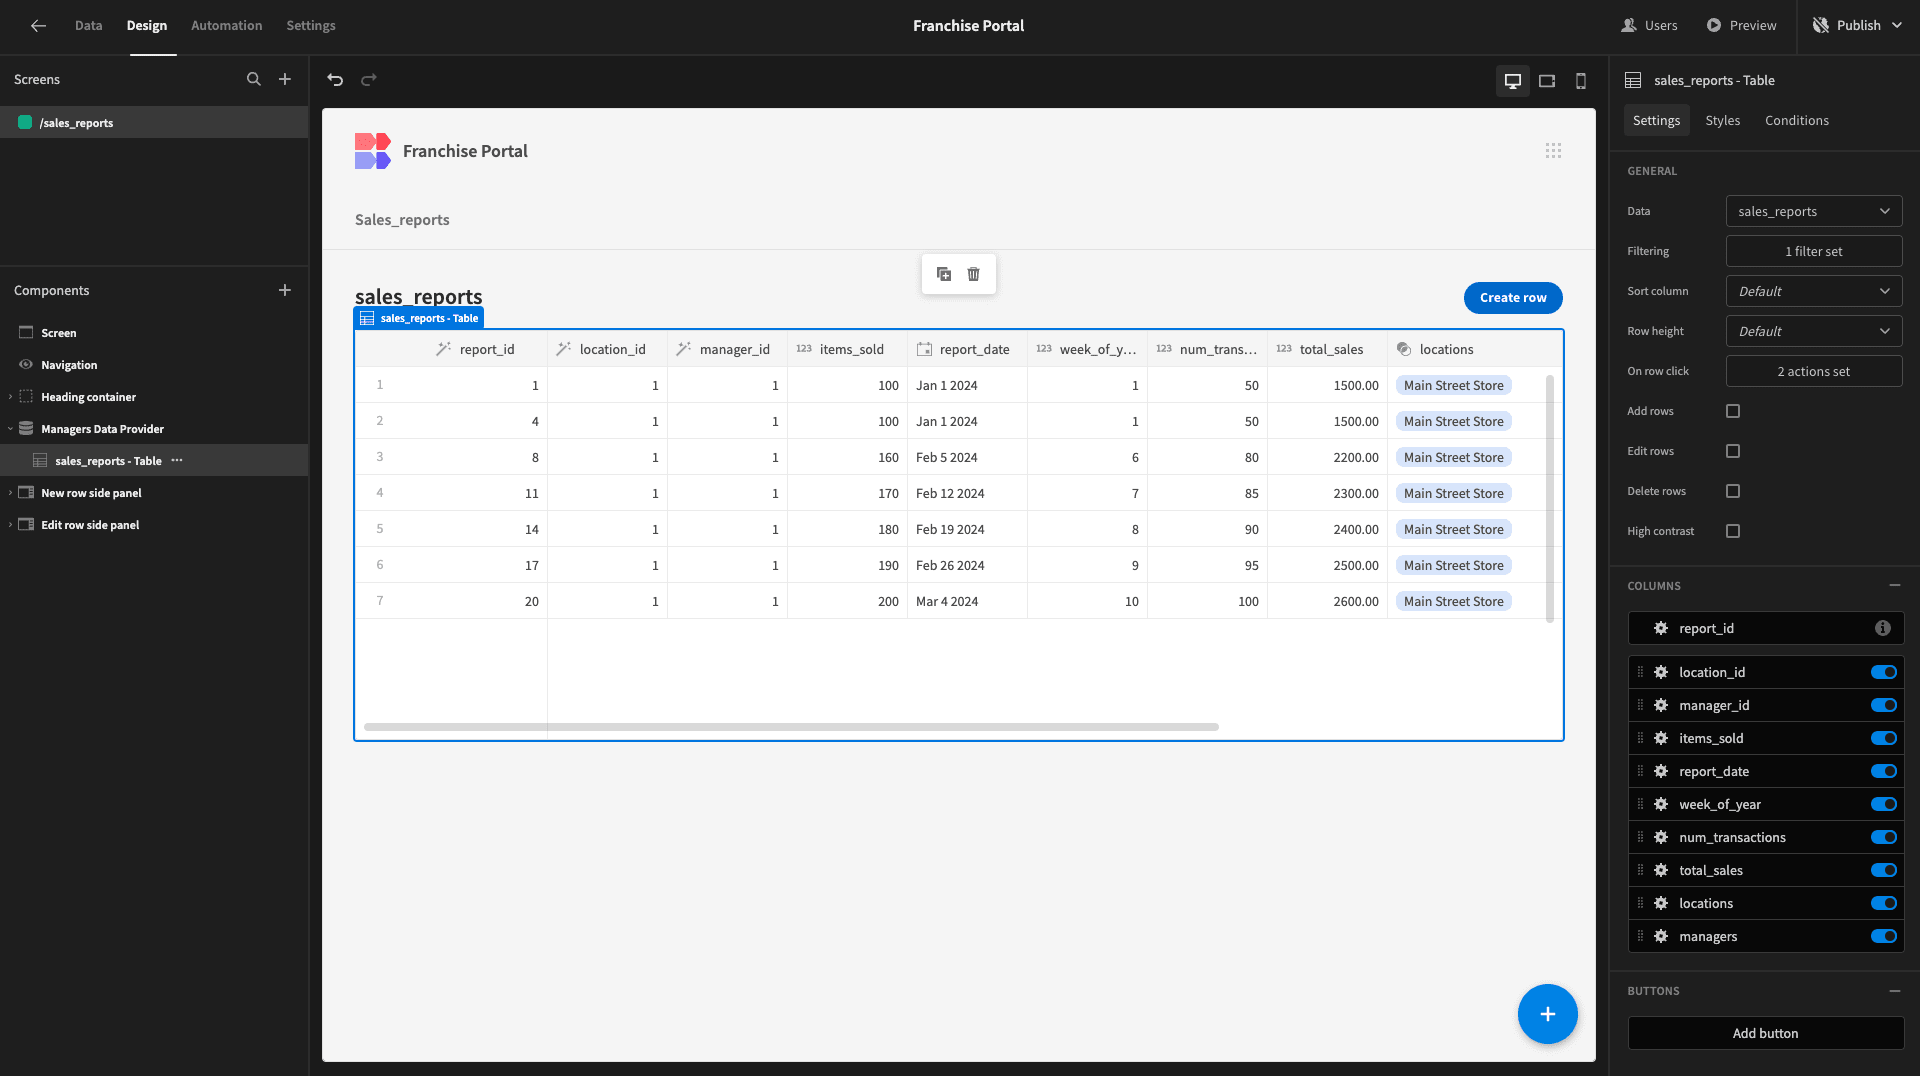
Next, we want to improve the appearance of our screen. The most obvious problem here is that our Table currently displays all of the attributes in our data schema - many of which are redundant or unhelpful for end-users.
We can use the switches on the right-hand side to configure which columns we want to display. We’re going to deselect location_id, manager_id, locations, and managers.
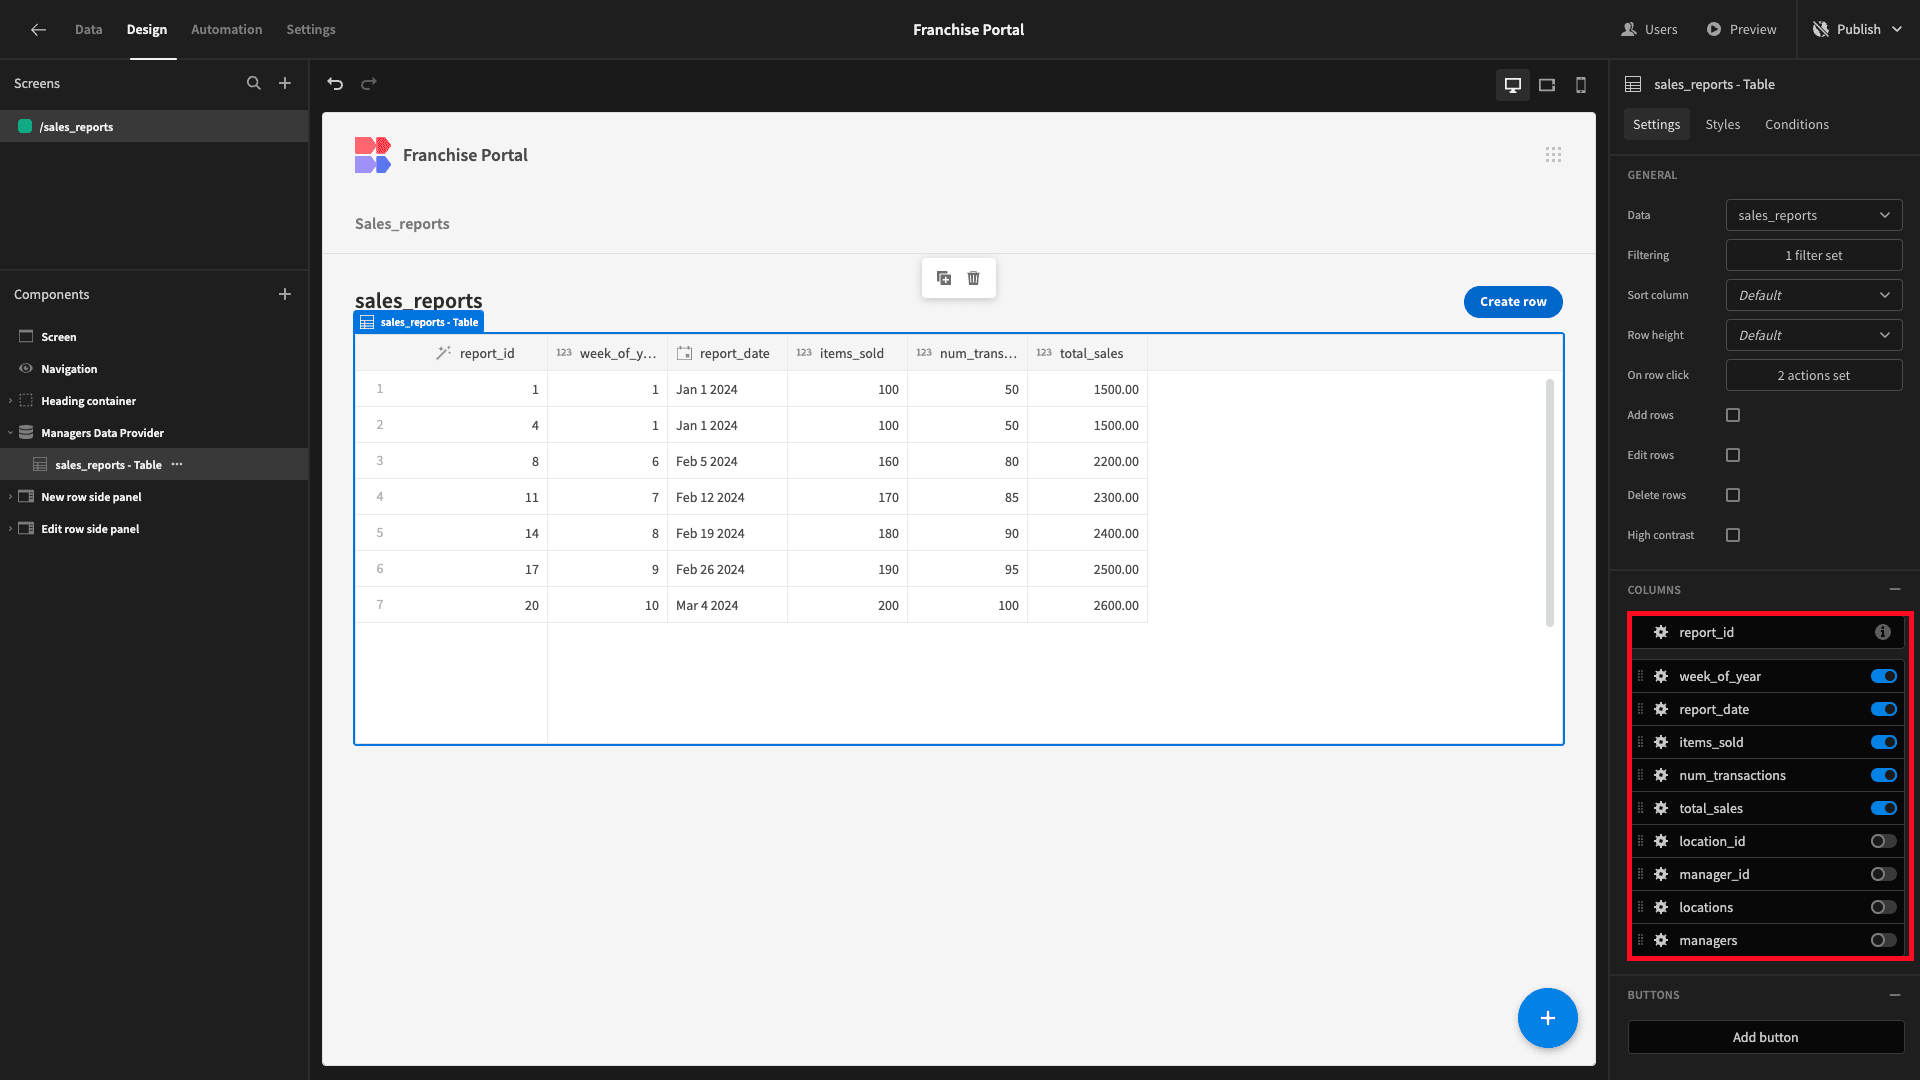
We can then use the Label setting for each of our remaining columns to provide more human-readable display texts.

We’ll also capitalize our heading.

Next, we want to make some changes to our edit row side-panel form. Specifically, we don’t want to give franchise managers edit access for our table’s existing rows. We only want them to be able to view their previous submissions.
The form itself is built with a component called a Multi-Step Form Block. This has a setting called Type, which we’re going to change to View, making our form read-only.
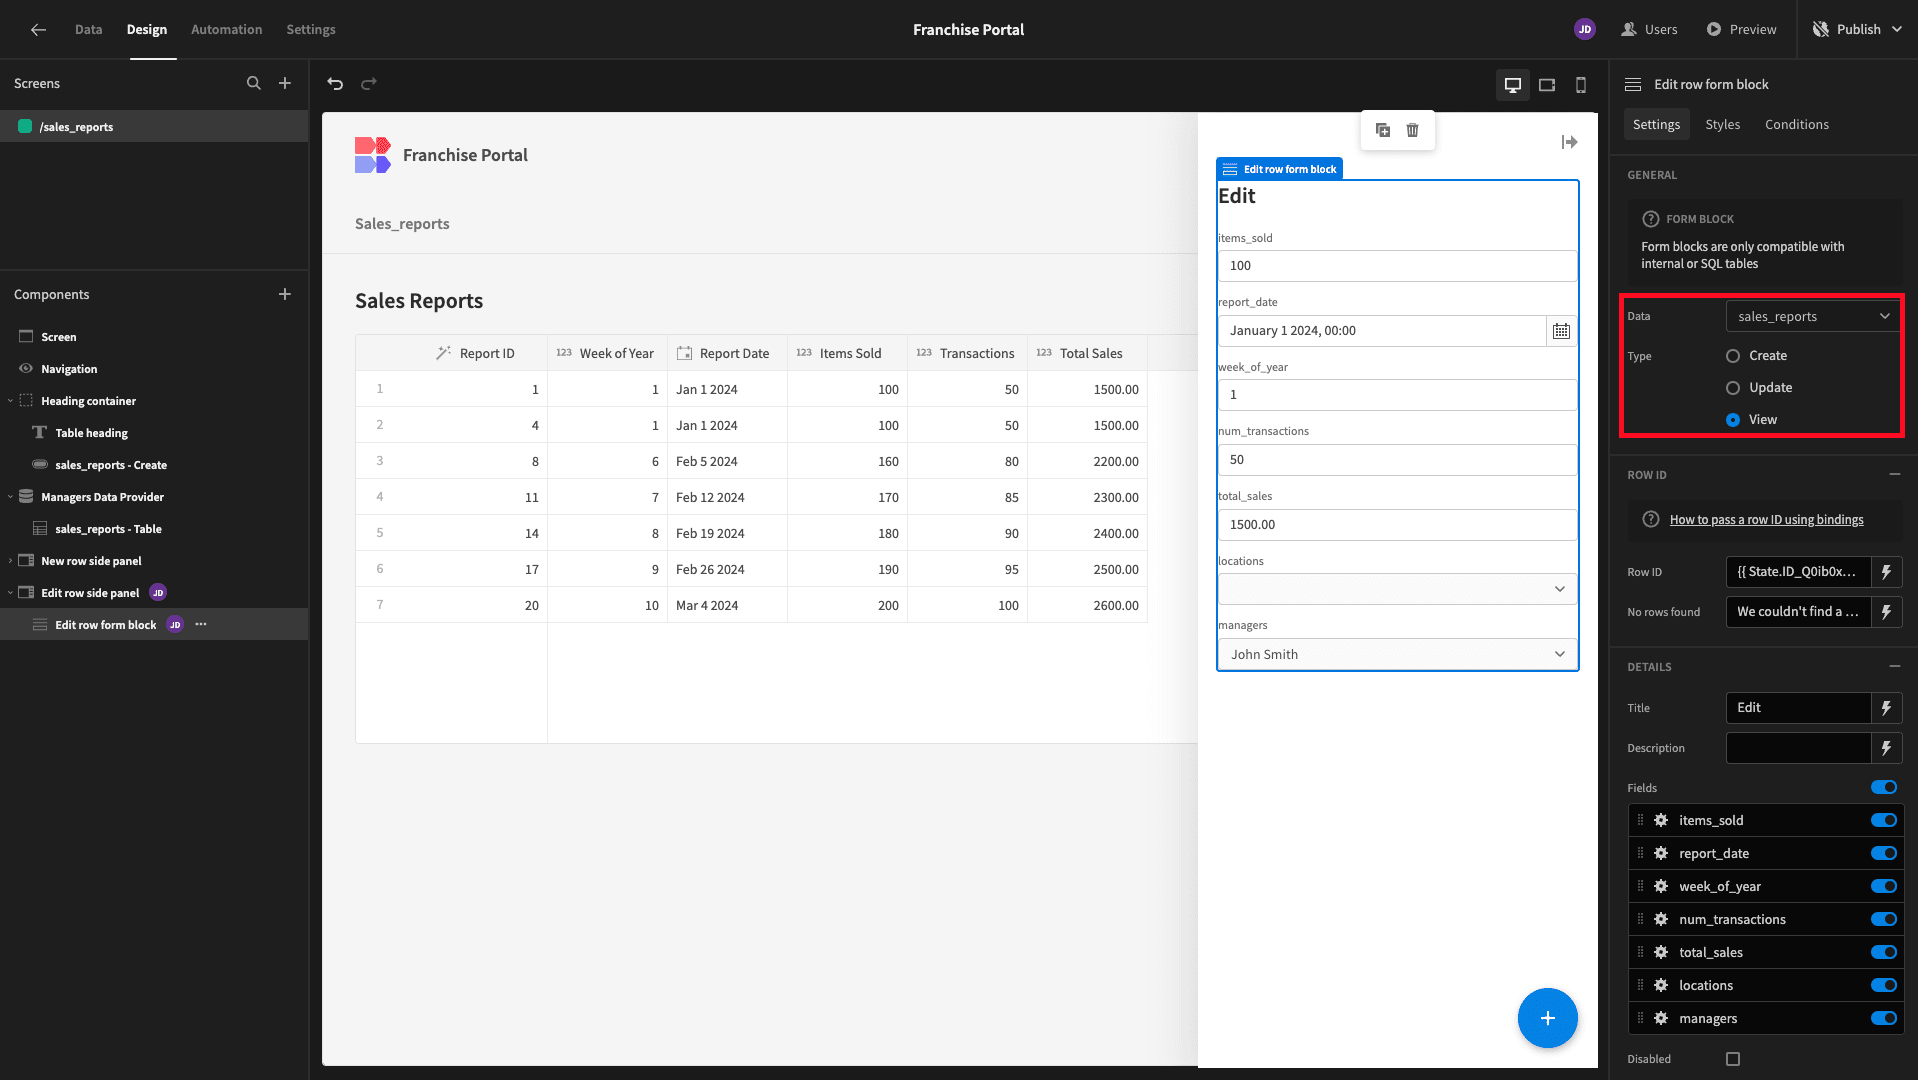
Then, we’ll repeat the same process as we did with our Table’s columns to remove the managers and locations fields - and tidy up the display texts for our remaining fields.
We’ve also given our form a more descriptive title.

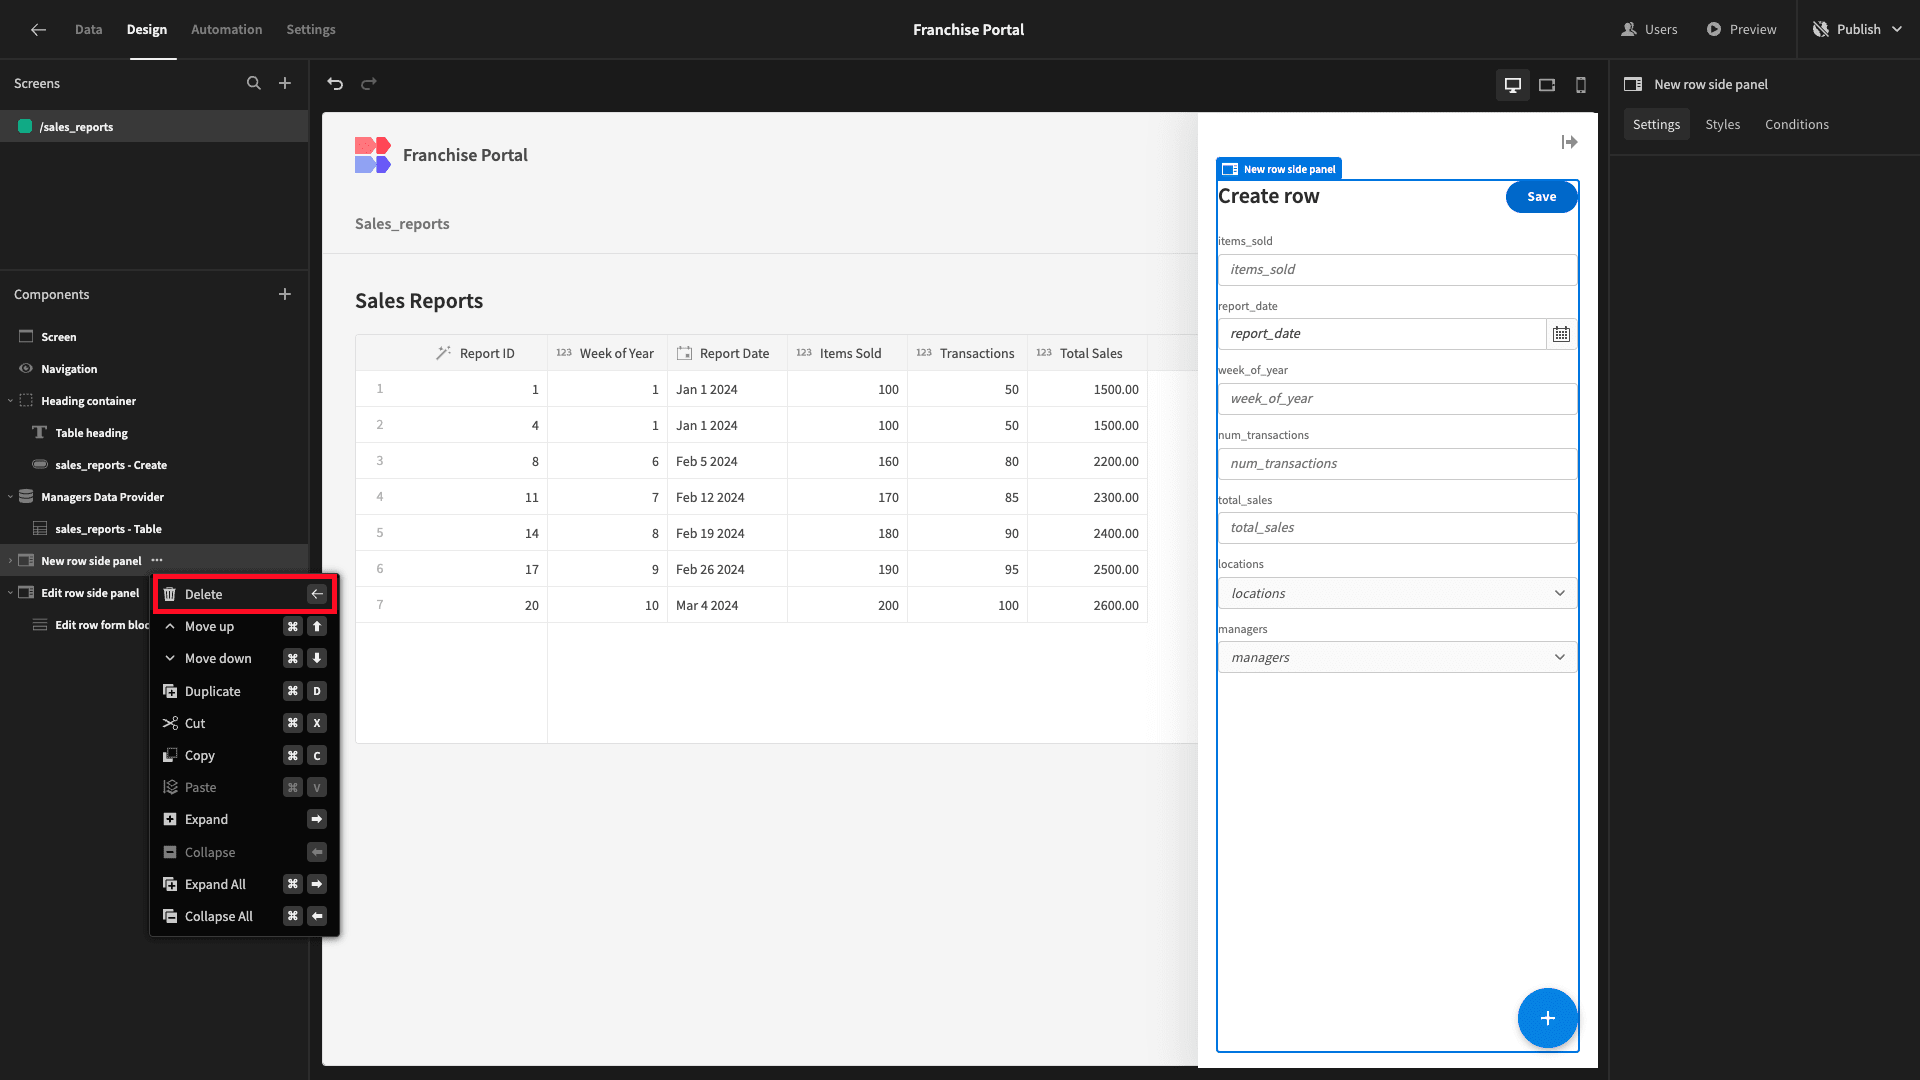
And the last change we’ll make is to delete our other Side Panel component.
Sales reporting form
We want to build a custom form for users to submit sales reports. This will open in a modal screen when users hit our Create Row button.
We’ll start by adding a new screen, this time selecting the Form layout.

Just like before, we’ll select the sales_reports table.

We then need to choose what kind of form we’d like. We need to create a row, so we’re selecting this option.

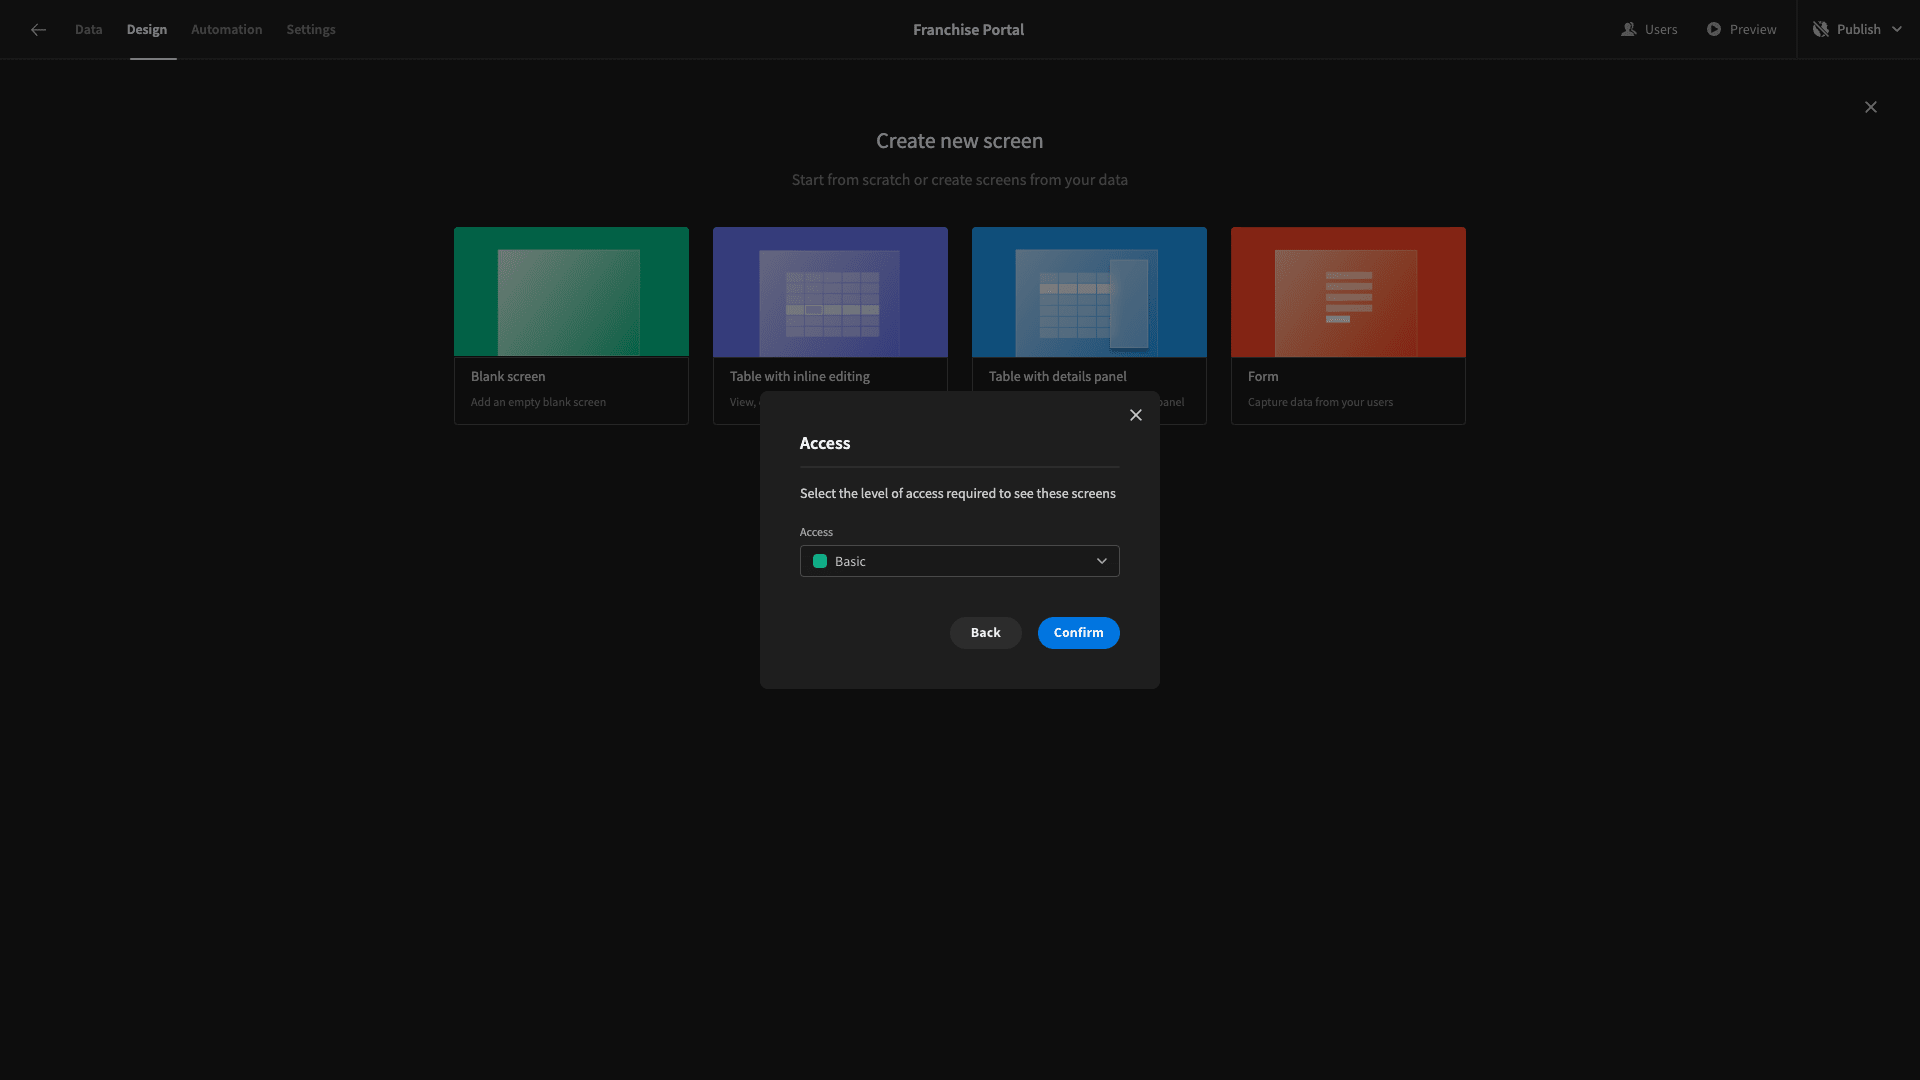
And lastly, we’ll leave our role set to Basic again.
Here’s what our form looks like out of the box.
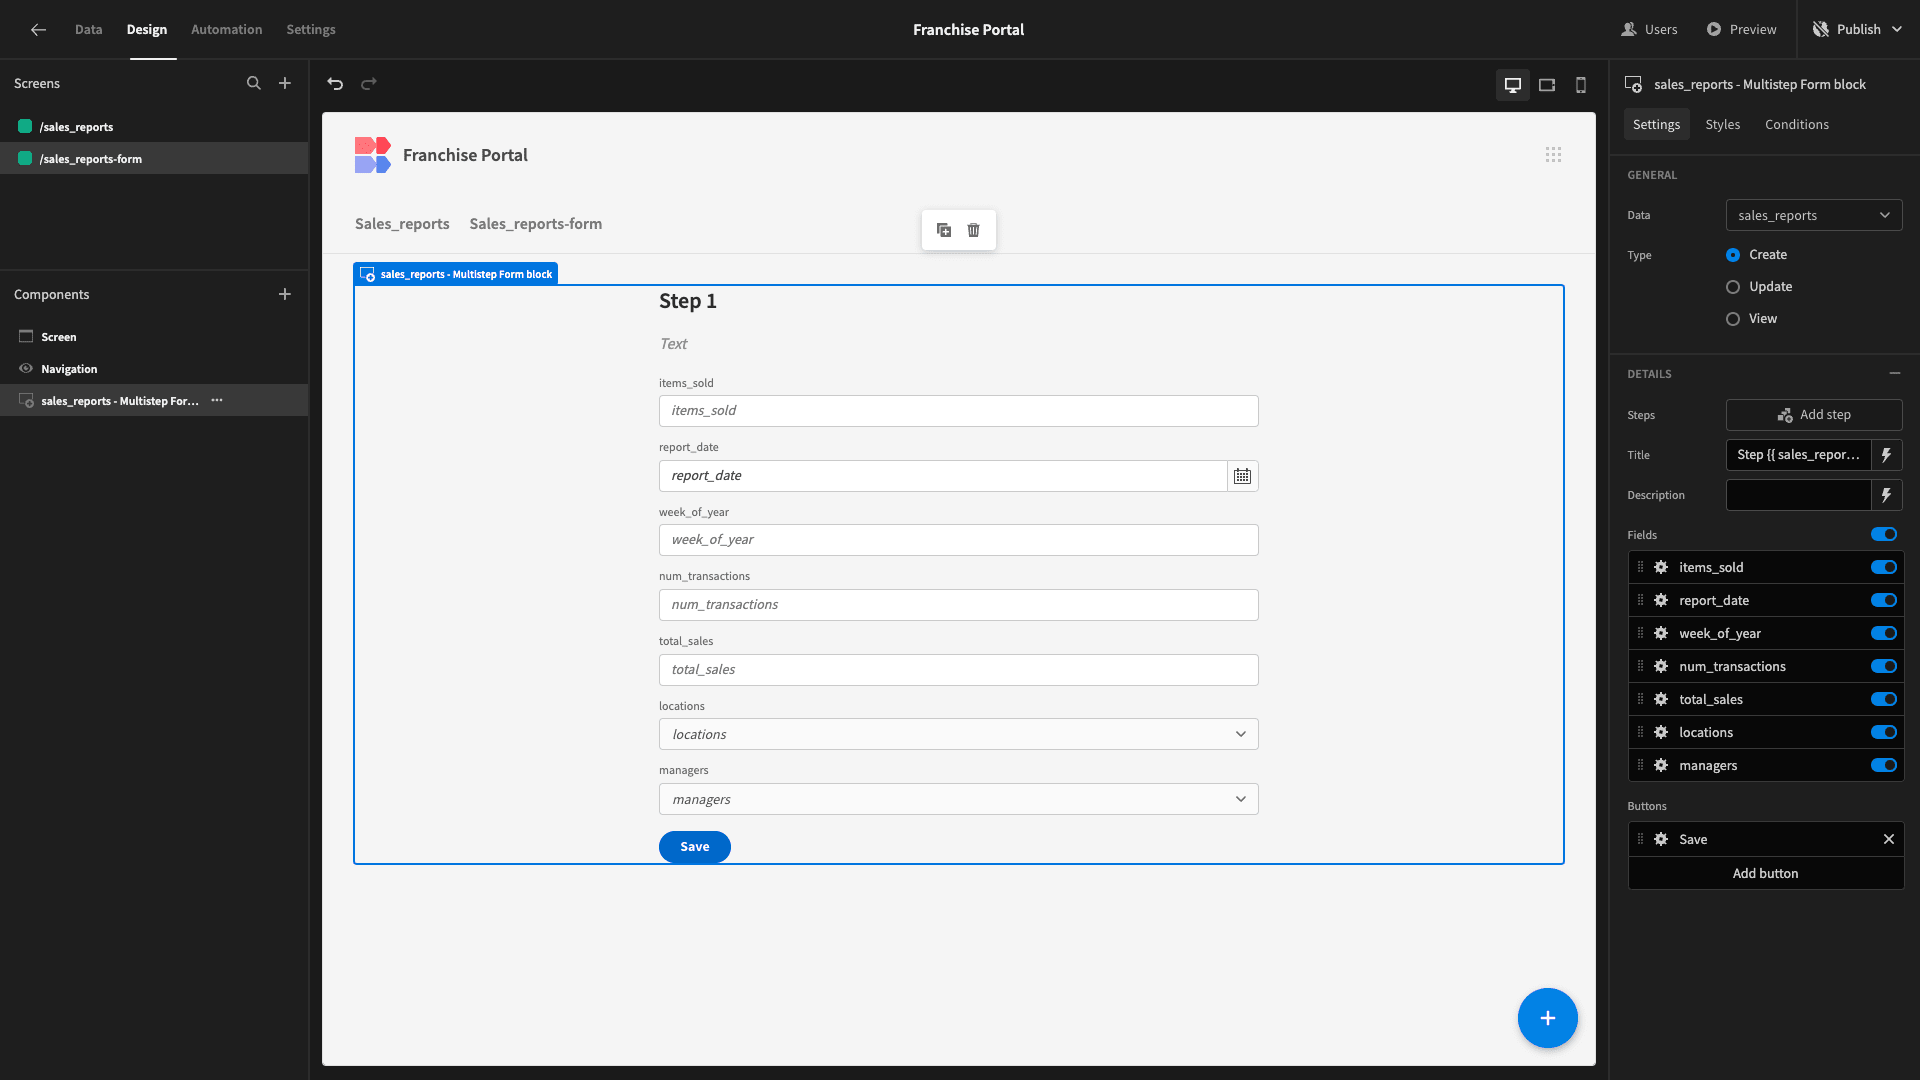
We only want to accept user inputs for some of our fields. With the others, we’ll automatically set values when a user saves the row.
So, we’ll start by configuring the fields we want to display. Like before, we’re deselecting the locations and managers fields - as well as cleaning up the display texts for our remaining fields and updating our form’s title.
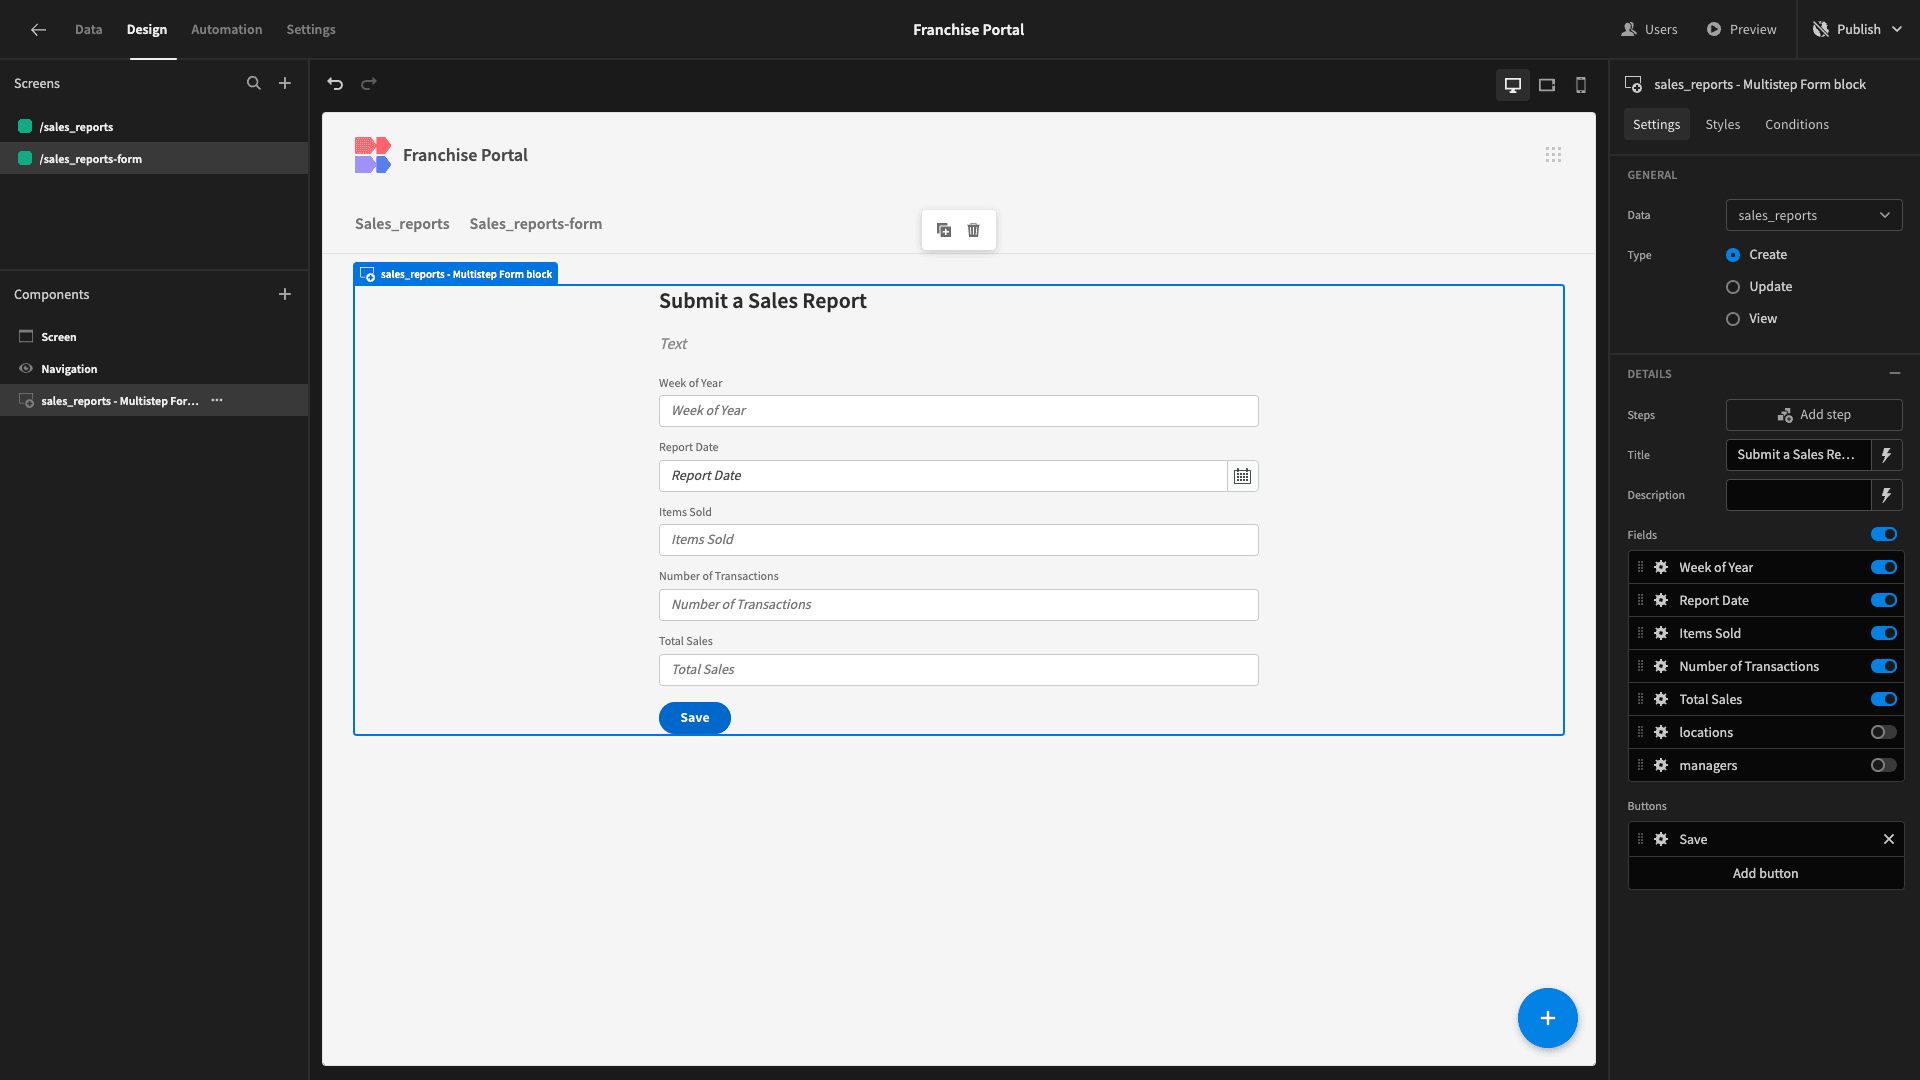
Then, under Styles, we’ll set our Button Position to Top.

For the locations and managers fields, we want to populate the values that correspond to the relevant managers row for the current user.
To do this, we’re going to need to follow the same process we did earlier of adding a Data Provider, pointing it at the managers table, and filtering it for the row where bb_user equals the current user’s _id.
So, we’ll start by adding a Data Provider beneath our form.

And we’ll add a filter expression for bb_user equals {{ Current User._id }}.
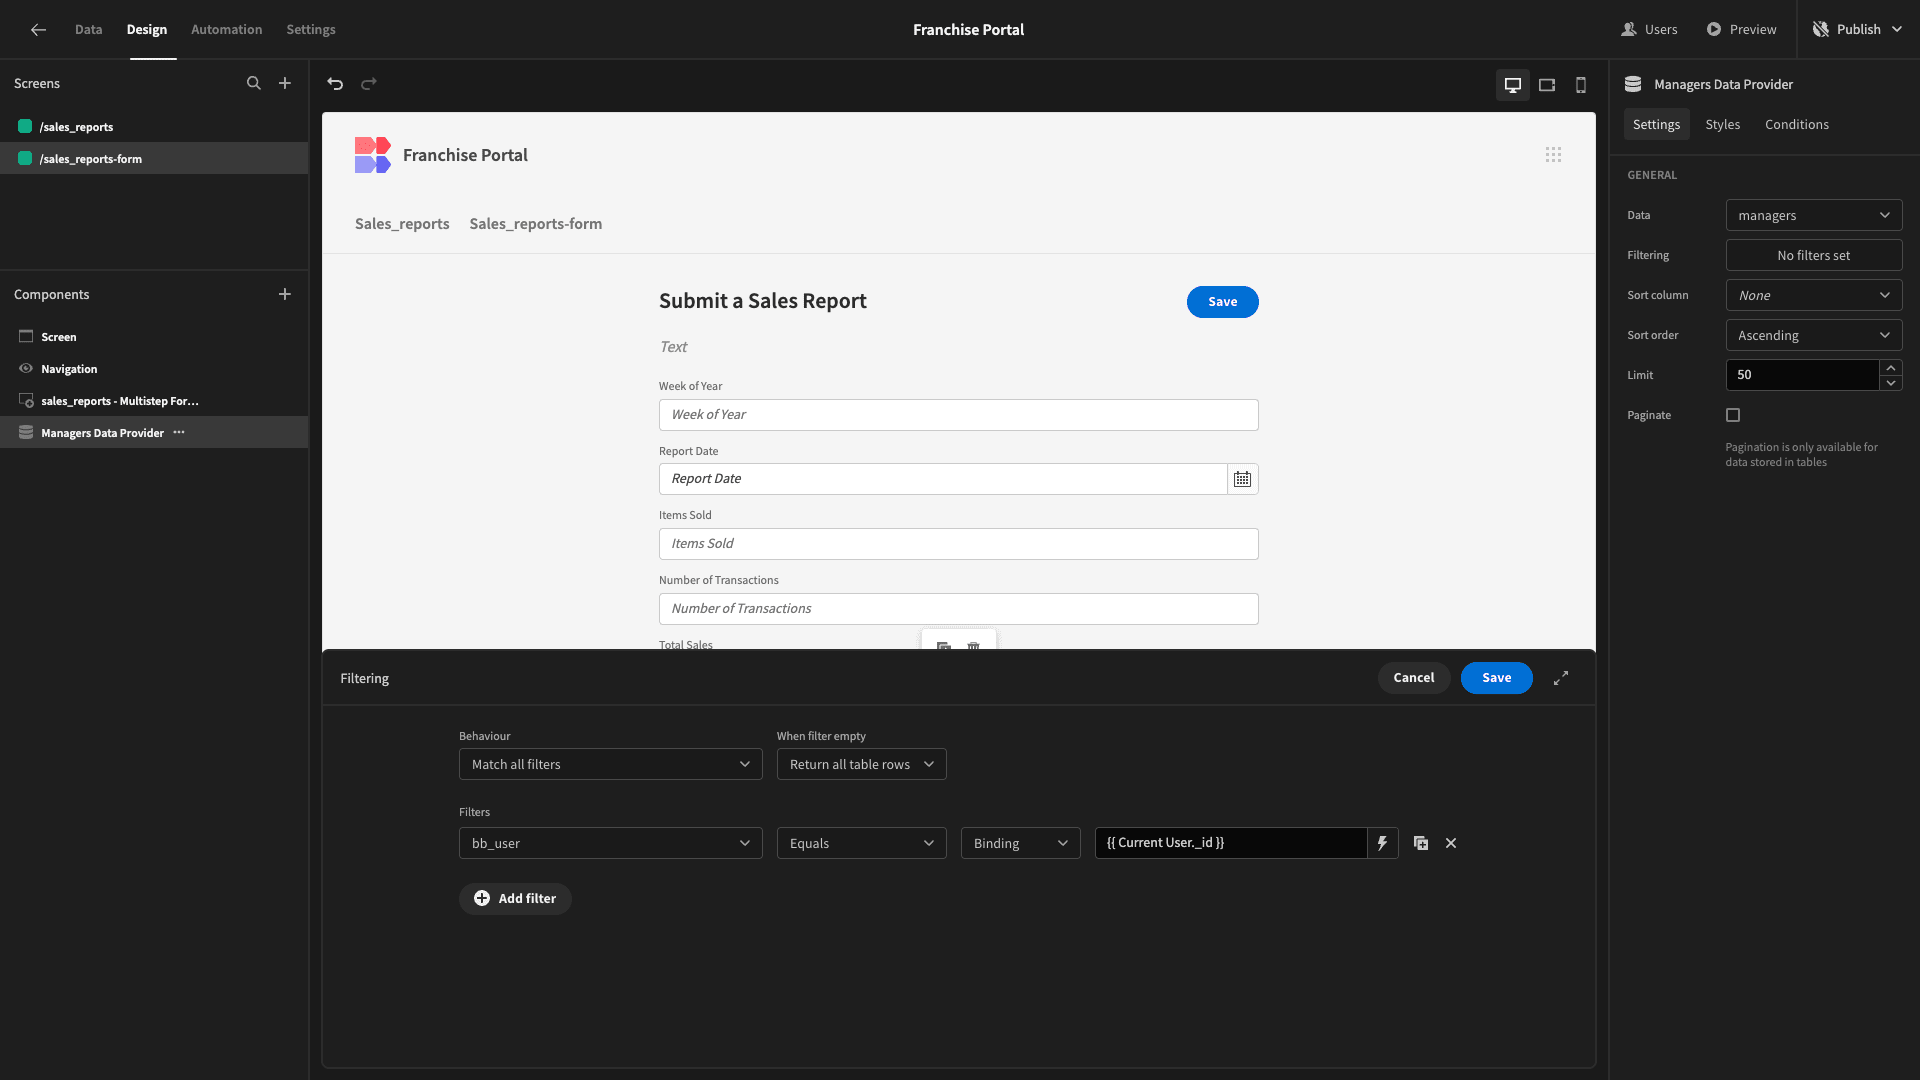
Then, we’ll open the Actions Drawer for our Save button. Here, we can see an action called Save Row.
We’ll use the Add Column button to populate our values.

We’re adding location_id and manager_id.
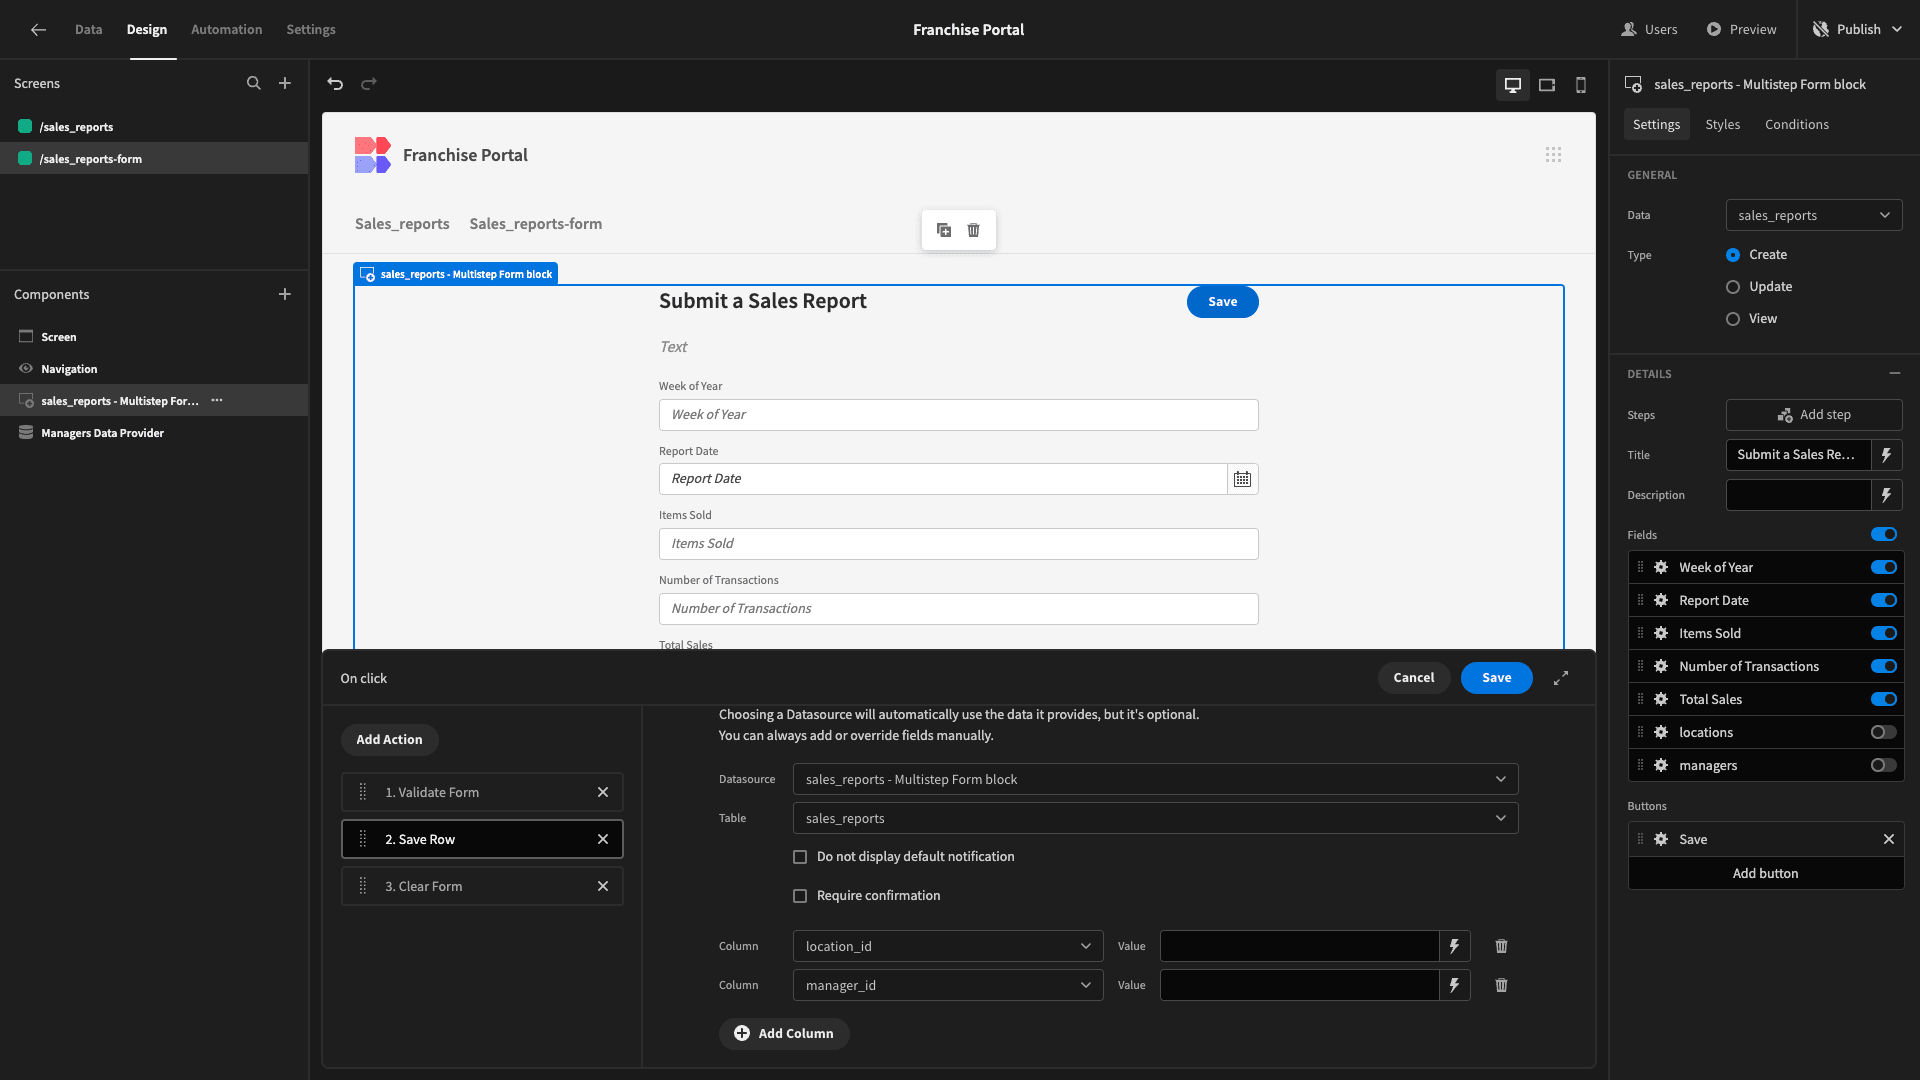
We’ll bind these to {{ Managers Data Provider.Rows.0.location_id }} and {{ Managers Data Provider.Rows.0.manager_id }} respectively.

Then, we’ll add a fourth action to our button called Close Screen Modal.

Now, head back to our /sales-reports screen and open the Actions Drawer for the Create Row button. Here, we’ll add a Navigate To action, set it to our form screen, and enable the option to open this in a modal.
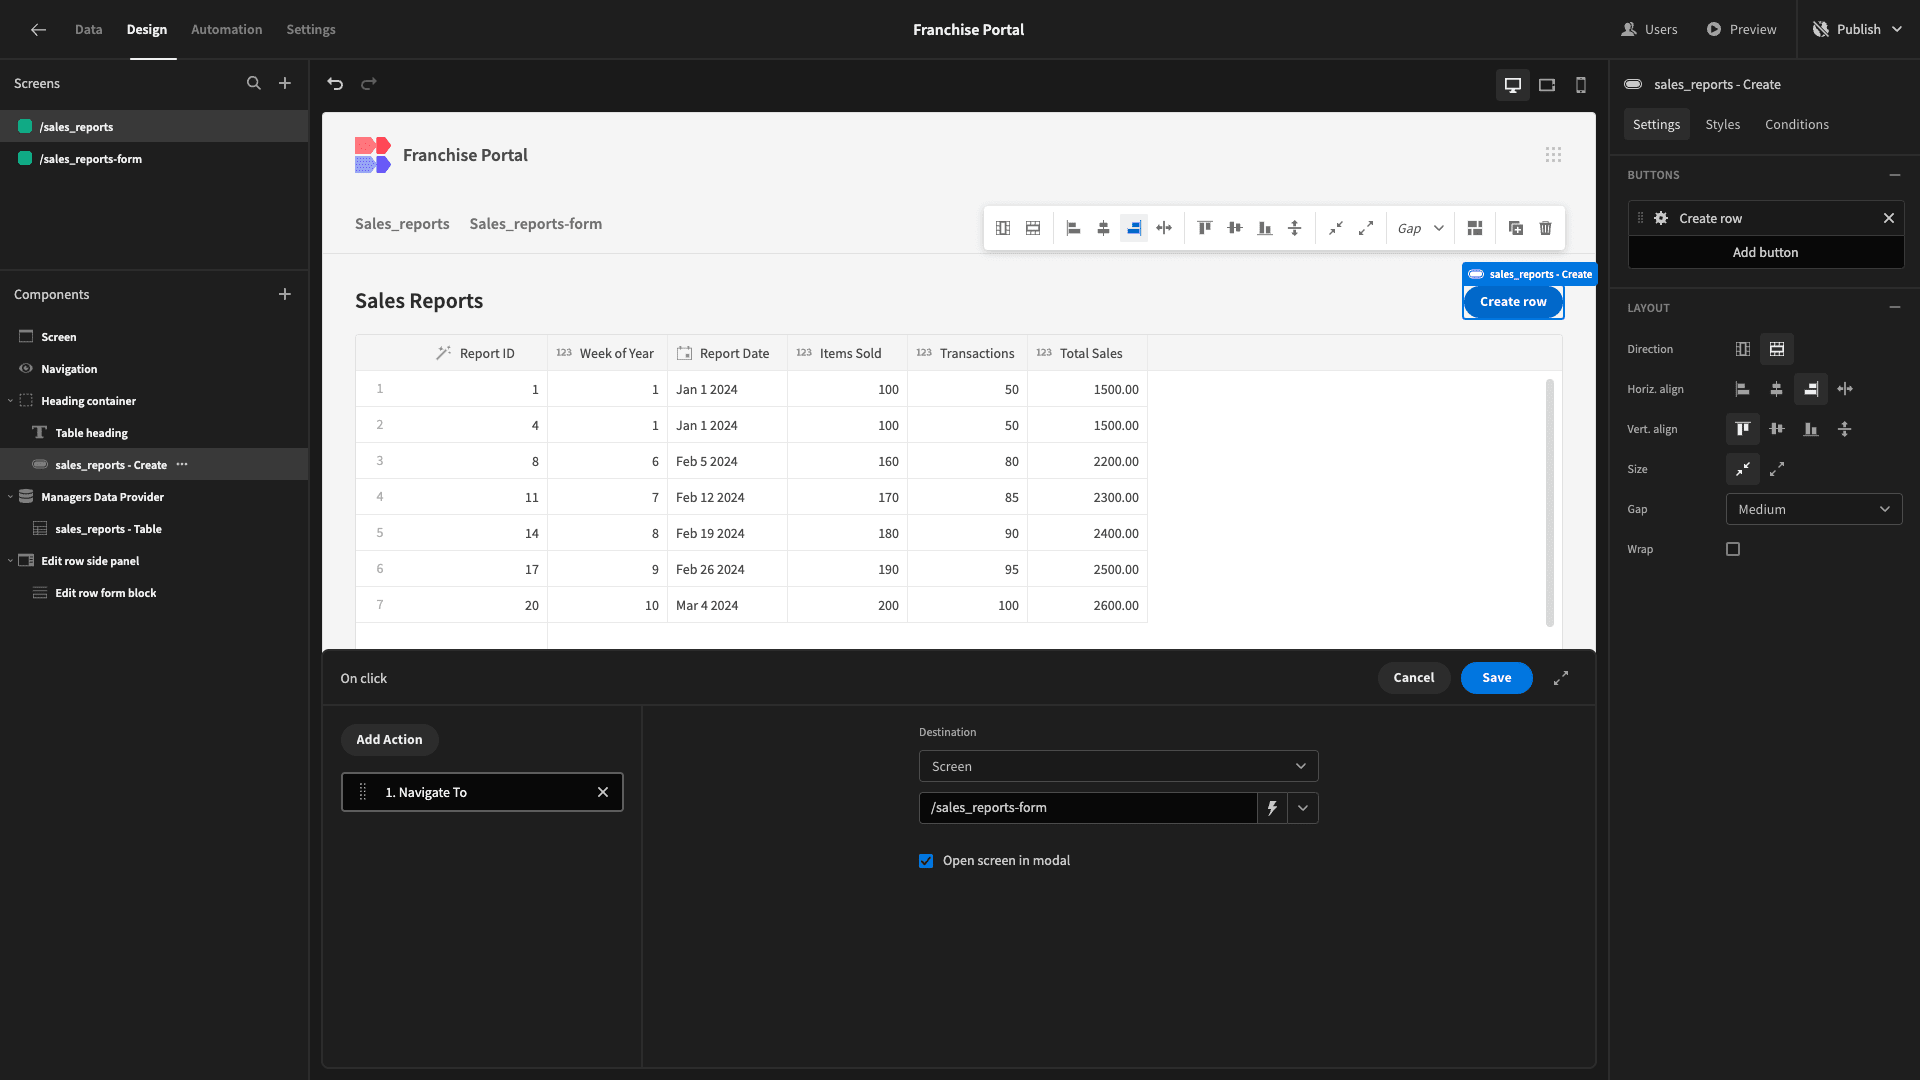
Now, we can preview our app to confirm that this works as we expect it to.
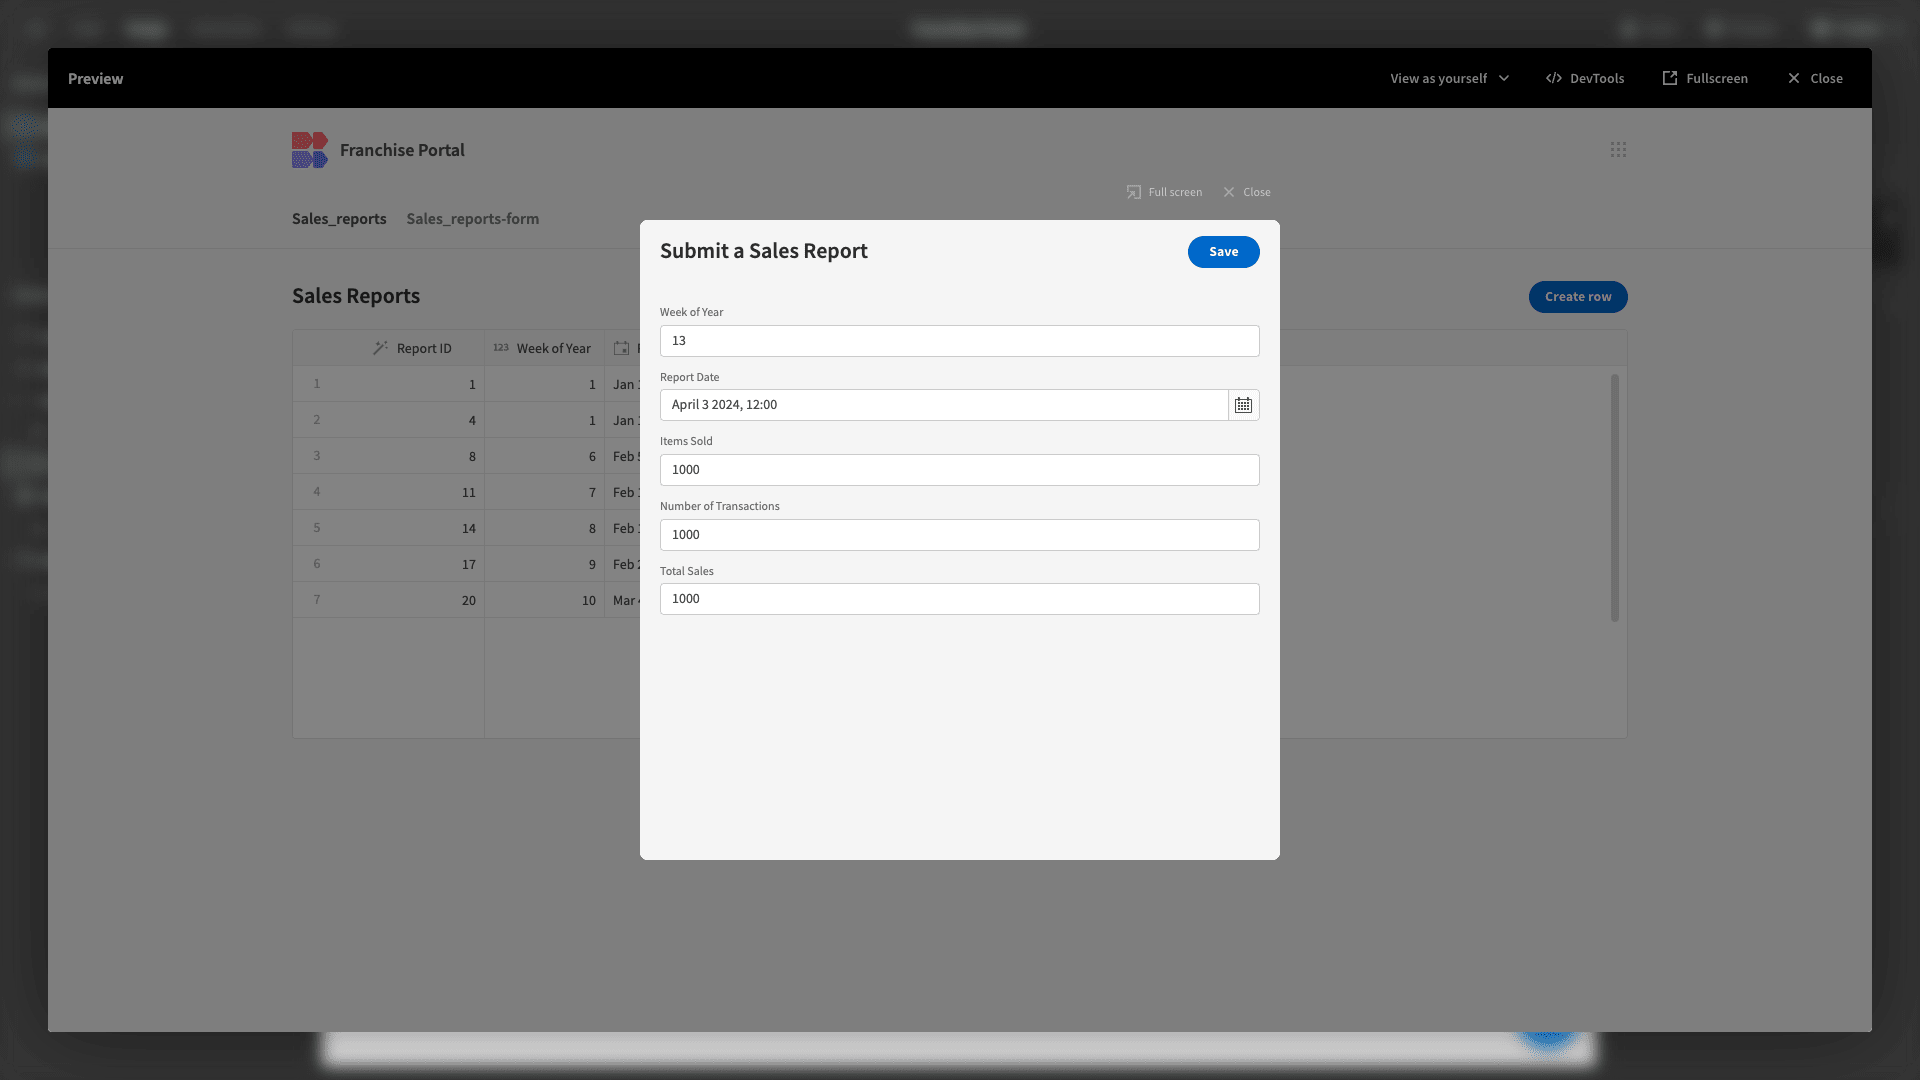
And, back in the Data section, we can see that our new row has been saved correctly, including all of its relationships.

3. Adding announcement cards
The next piece of functionality we want to build out is enabling our franchise managers to receive and view company-wide announcements.
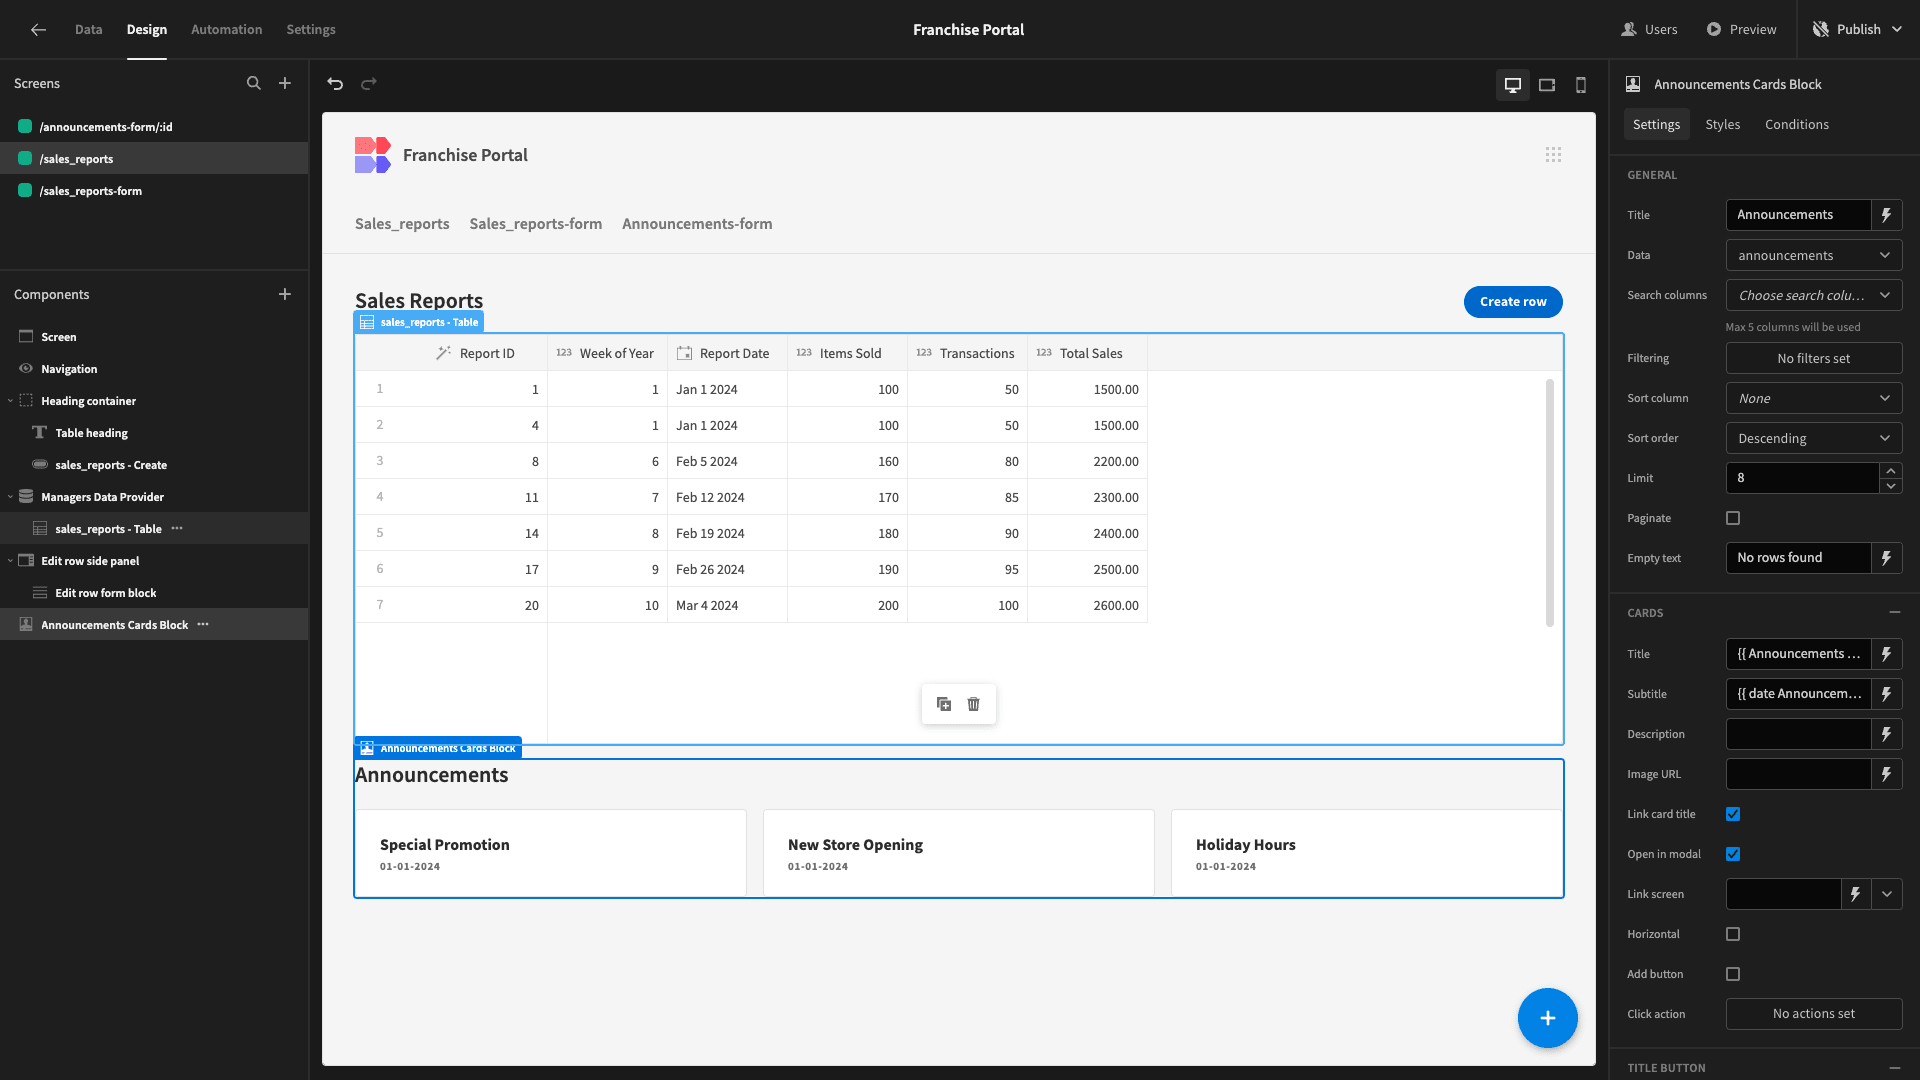
We’ll start by adding a component beneath our existing Table called a Cards Block. This accepts a data source and iterates over it, displaying relevant information for each row.
We’re setting ours to the announcements table. We’ll also give it a descriptive title.
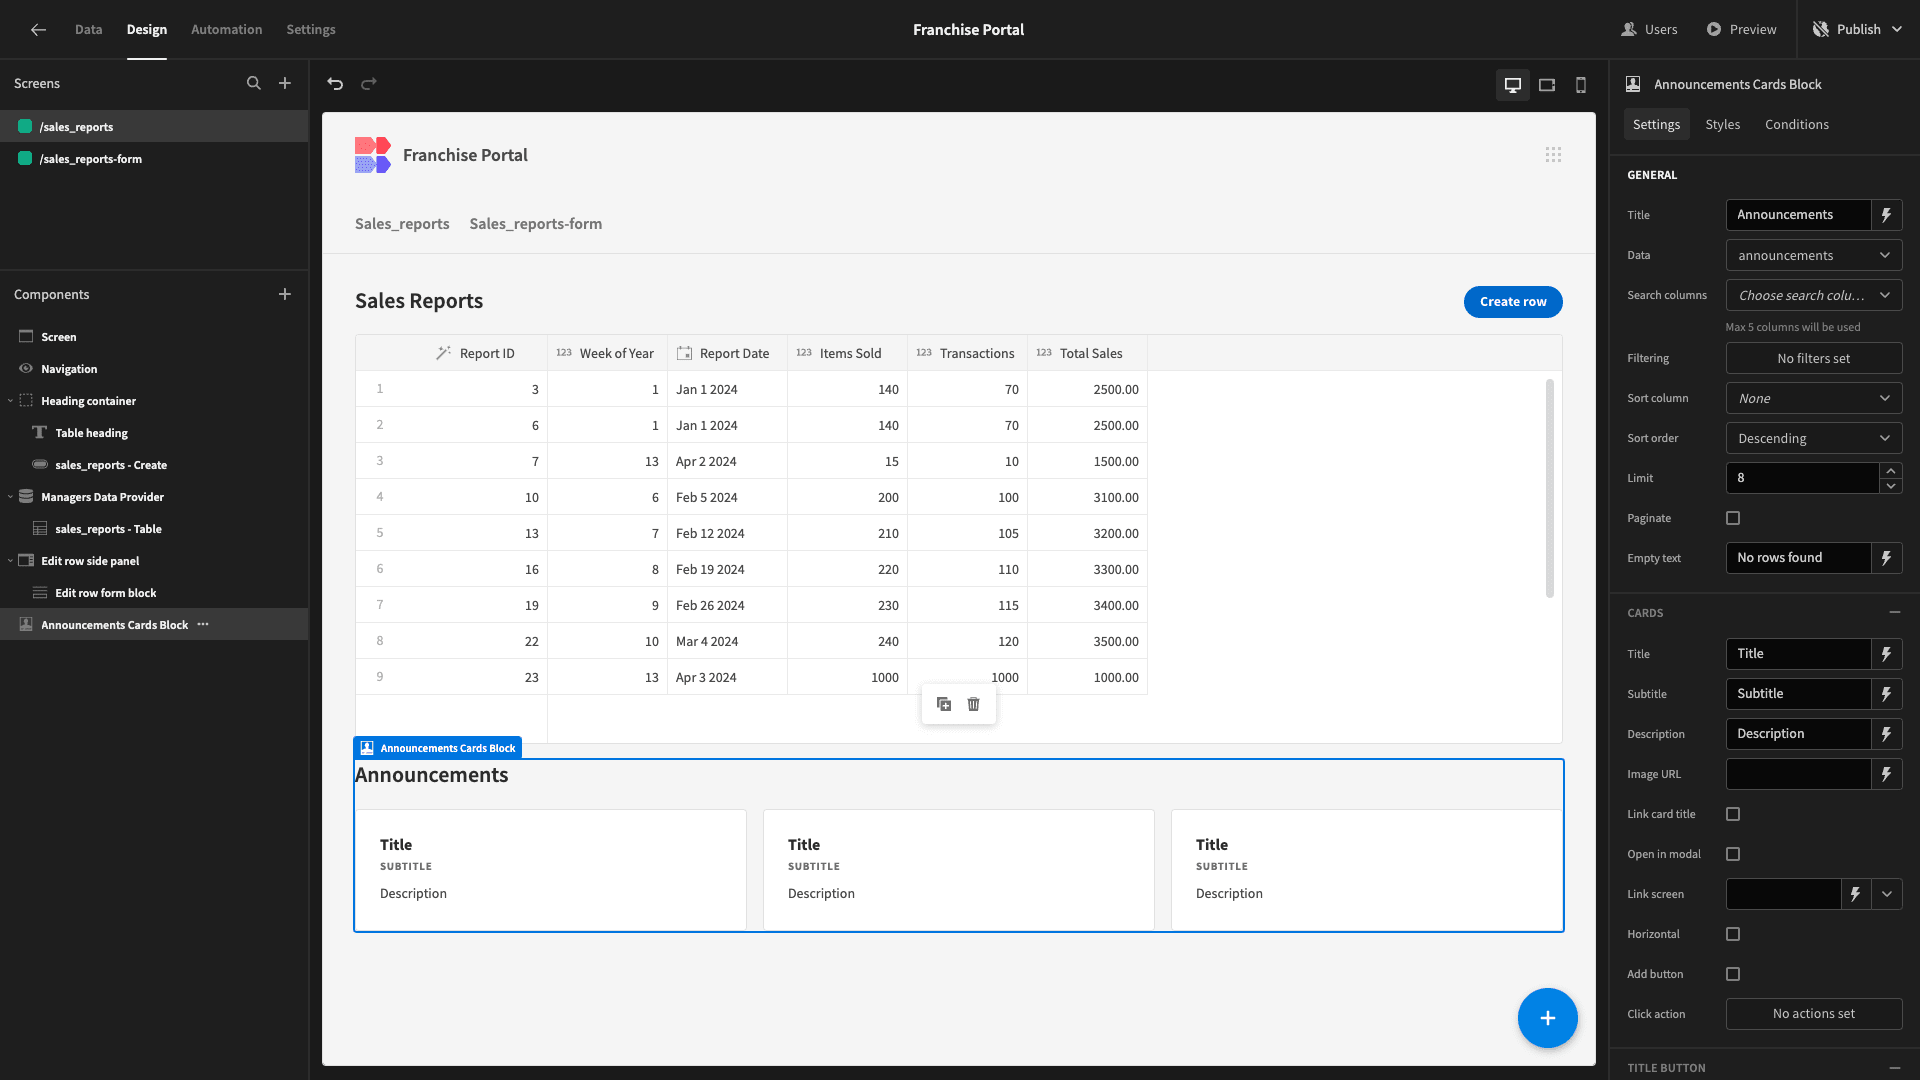
Each of our cards can display three pieces of display text - a title, subtitle, and description.
We’ll populate these with the following bindings:
- Title - {{ Announcements Cards Block.announcements.title }}
- Subtitle - {{ date Announcements Cards Block.announcements.announcement_date “MM-DD-YYYY” }}
We’re leaving the description blank.
For the subtitle, we’re using a handlebars helper called {{ date }} to format our announcement_date attribute in a more human-readable format. This accepts two arguments - the variable we want to format and the format we want to display it in.
Here’s what this looks like.

We also want our individual cards to be clickable, enabling users to view the full details of the announcement as a modal screen.
Again, we’ll start by creating a new screen with the form layout. This time, we’re selecting the announcements table and choosing the option to create a read-only form.
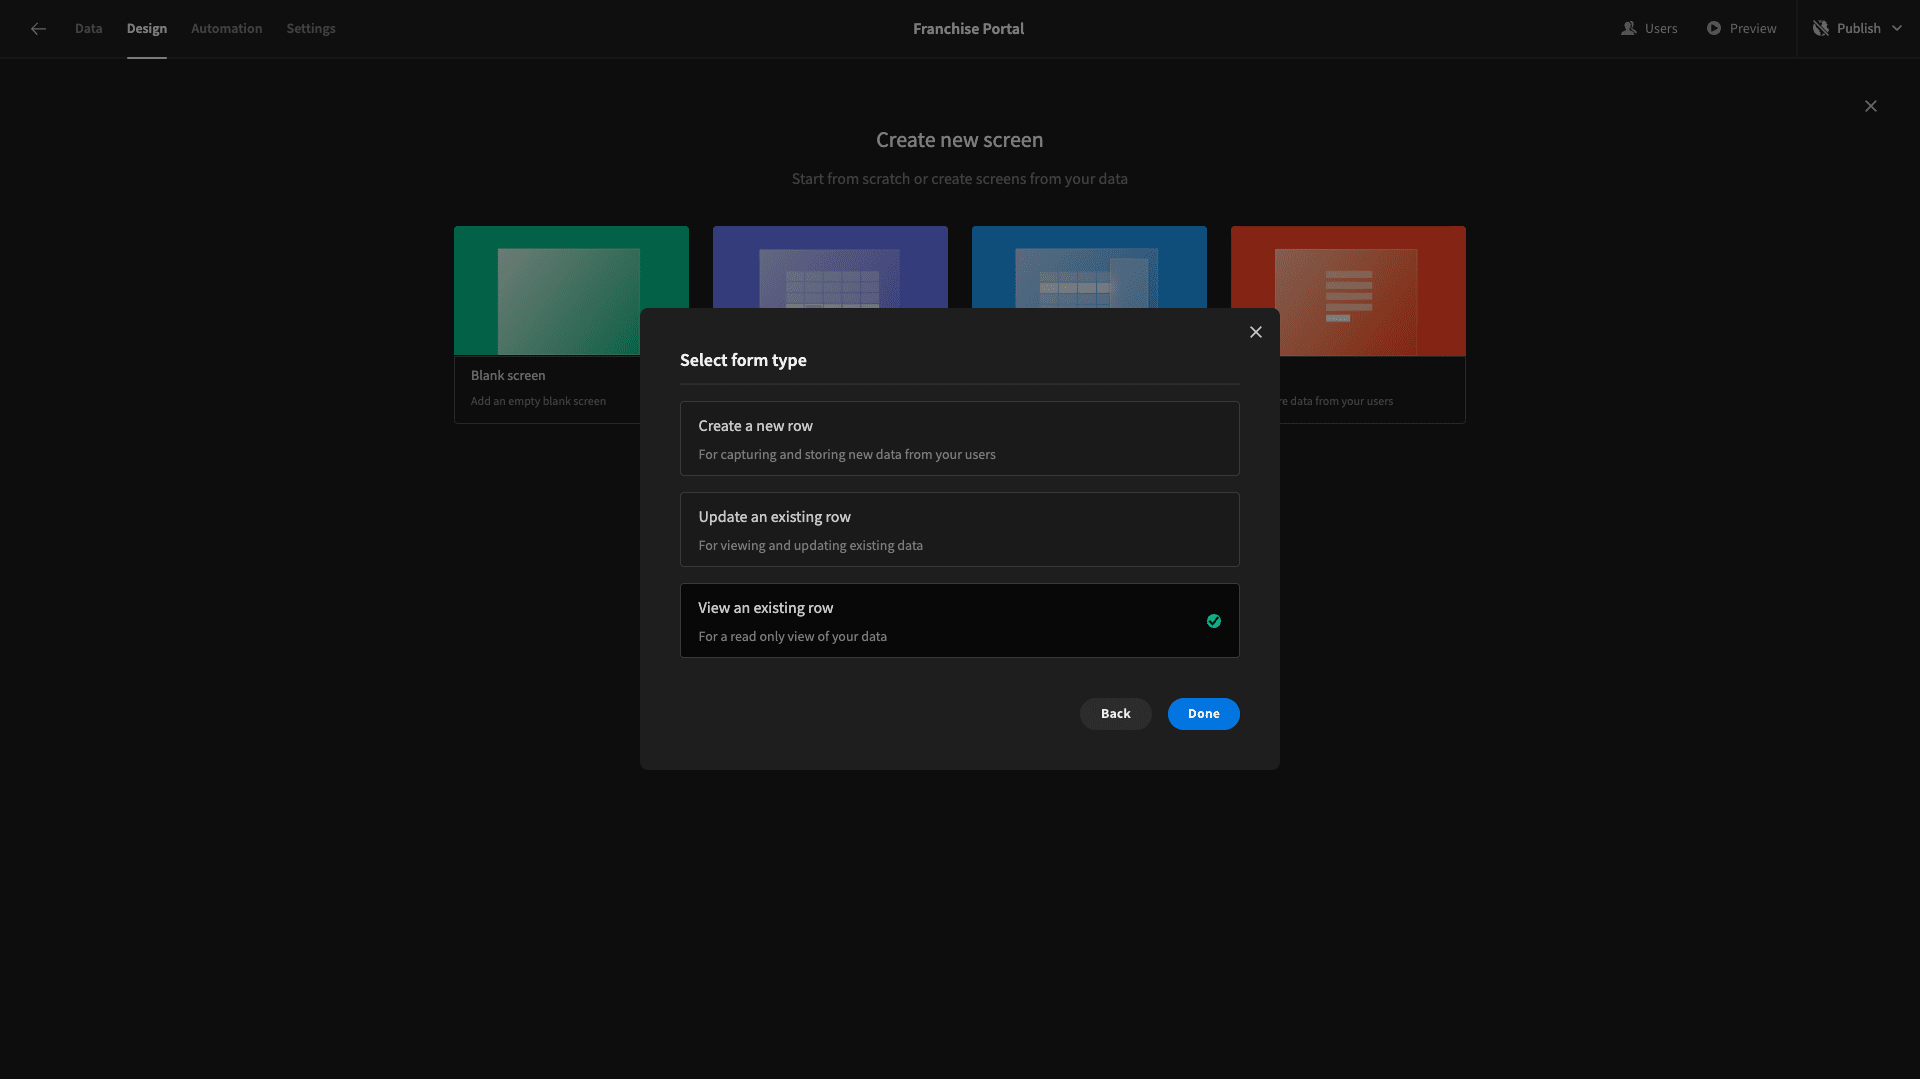
Just like before, we’ll leave the minimum role set to basic.
Here’s our form.

The next thing we need to do is add some logic so that the appropriate announcement is loaded when a user clicks one of our cards.
Currently, the page path is /announcements-form, but we want to update this to append a bindable value to the end. So, under Screen, we’ll update the URL to /announcements-form/:id.
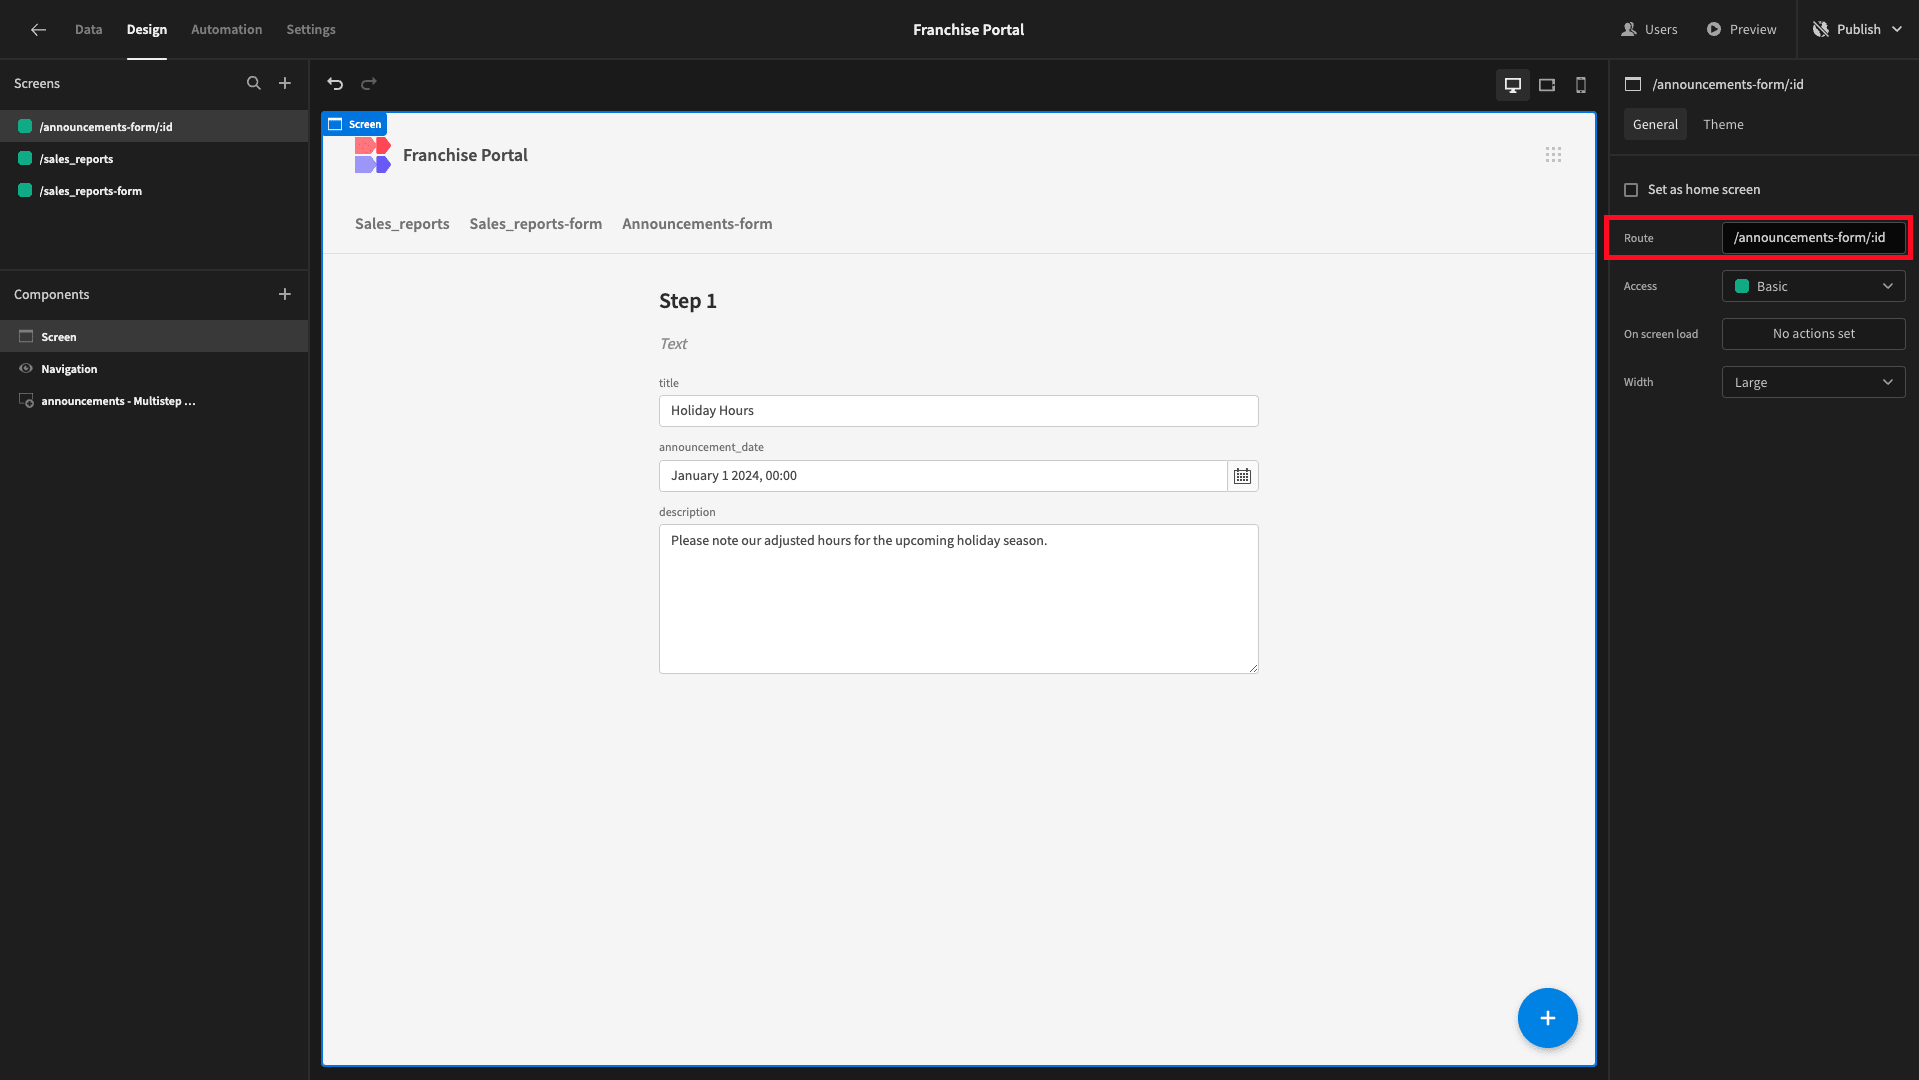
This enables us to pass the _id of the relevant announcements row to our form when we click on one of our cards on the other screen.
We’ll then set the form’s Row ID setting to {{ URL.id }}.
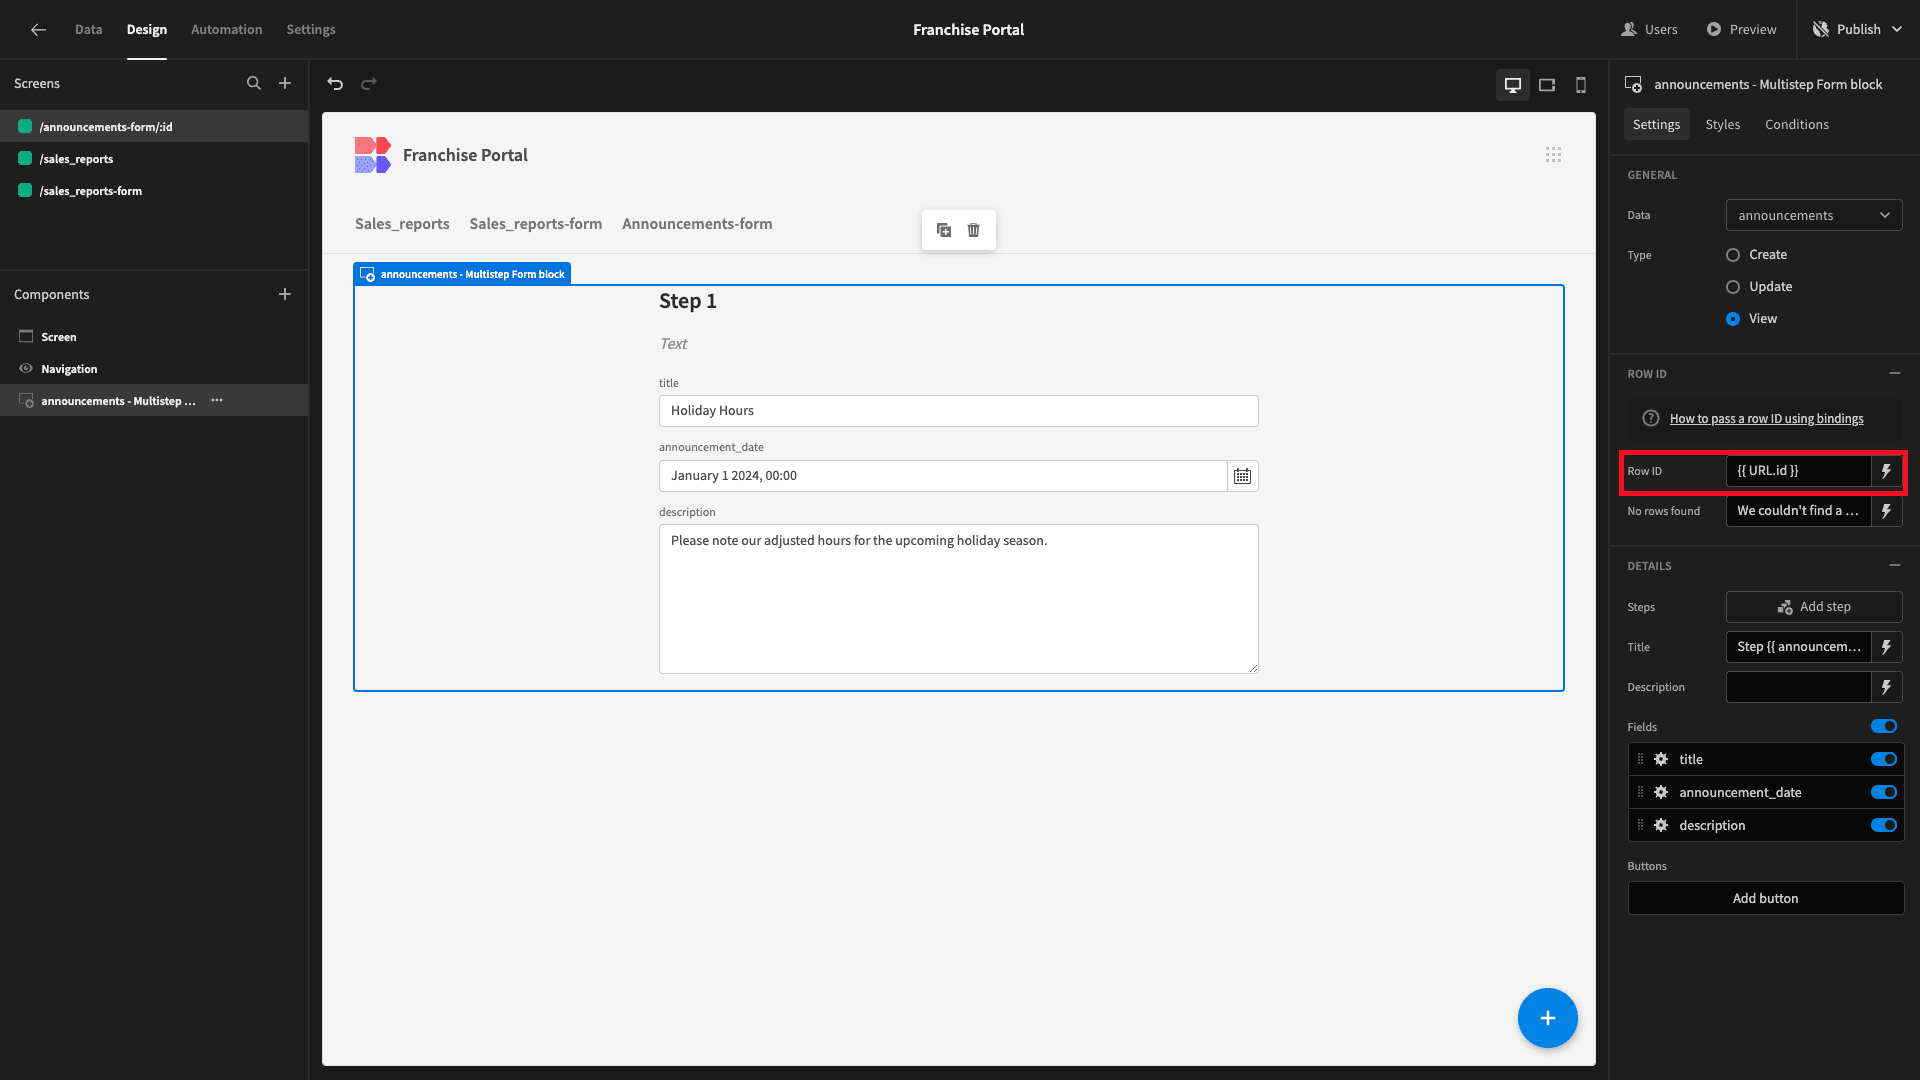
Lastly, we’ll disable the title form field and bind it to the Title setting of the Form Block instead. We’ll also update the display texts for our remaining fields.

Now, head back to our main screen and select the Cards Block. We’ll first enable two options called Link Card Title and Open in Modal.
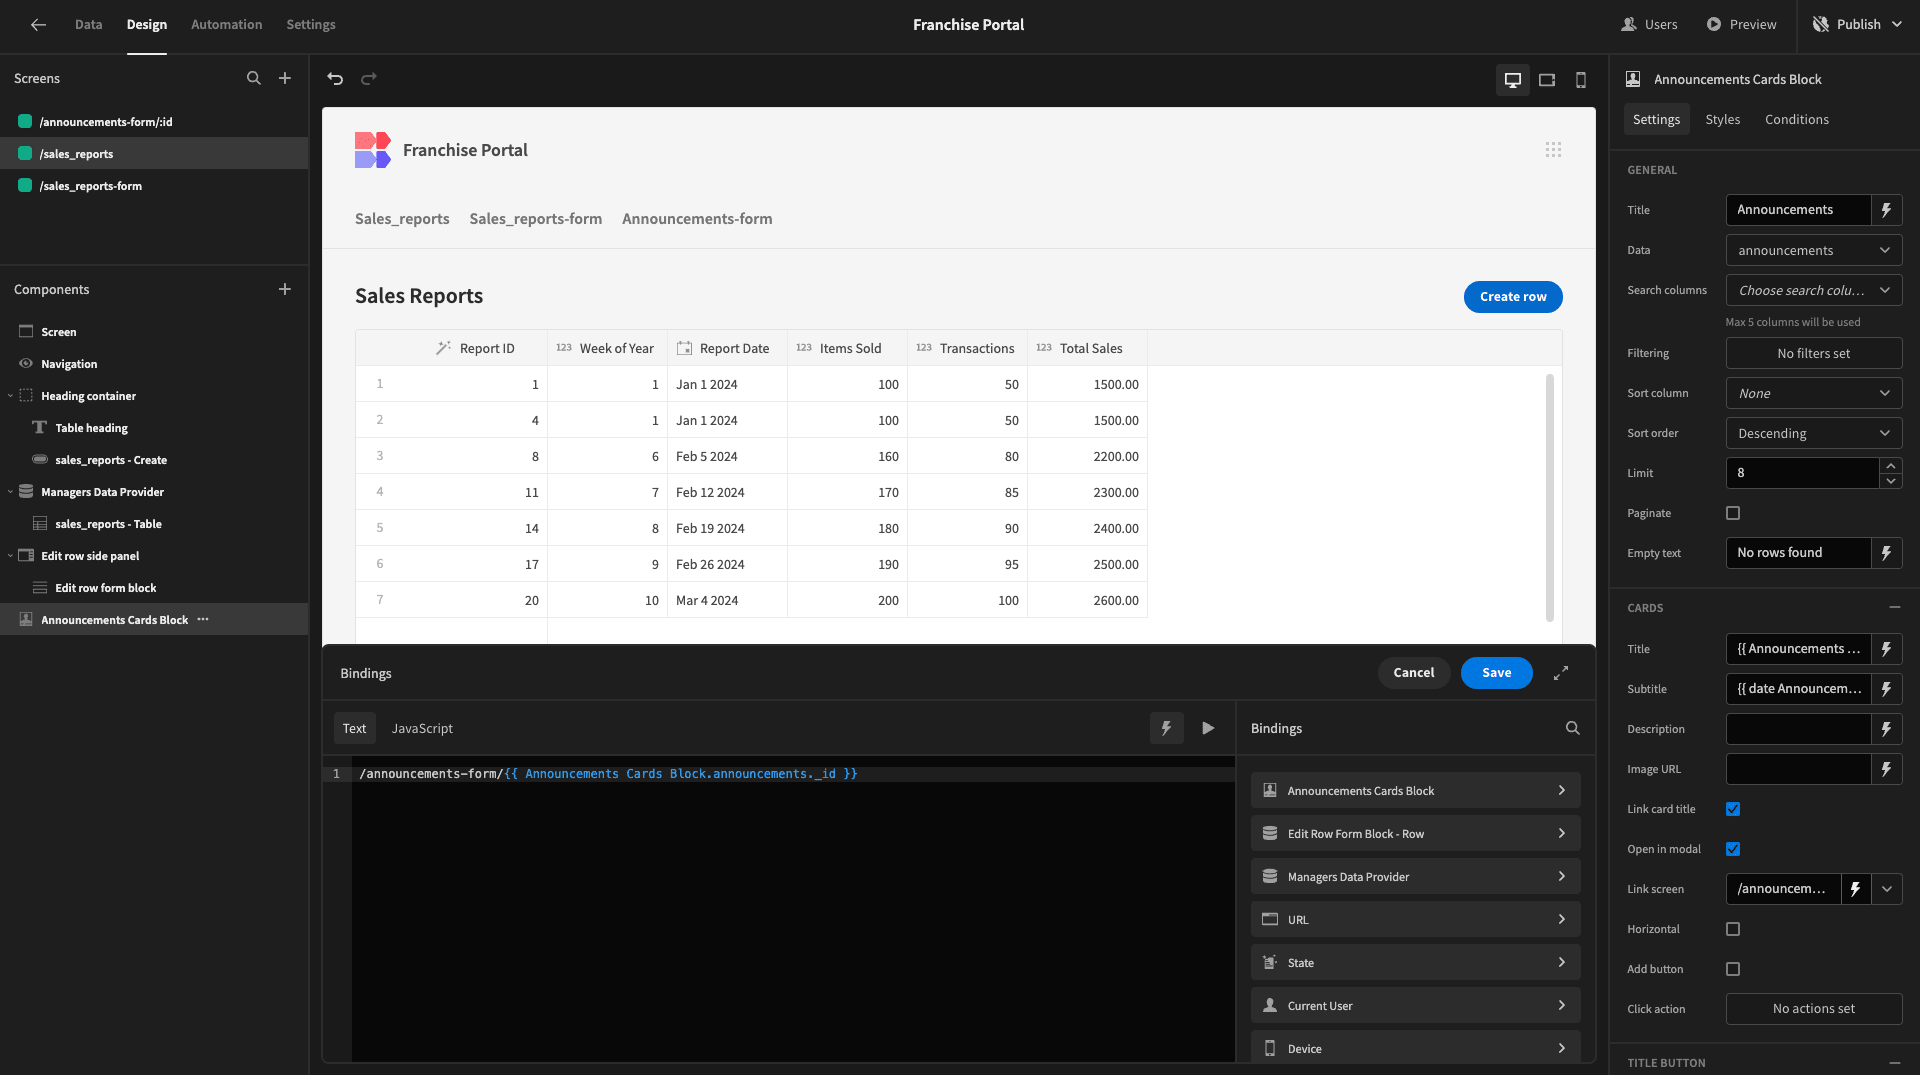
Then, we’ll set the Link Screen to /announcements-form/{{ Announcements Cards Block.announcements._id }}, populating our URL variable with the _id attribute of the relevant announcements row.
And we can preview our app to confirm that this works.
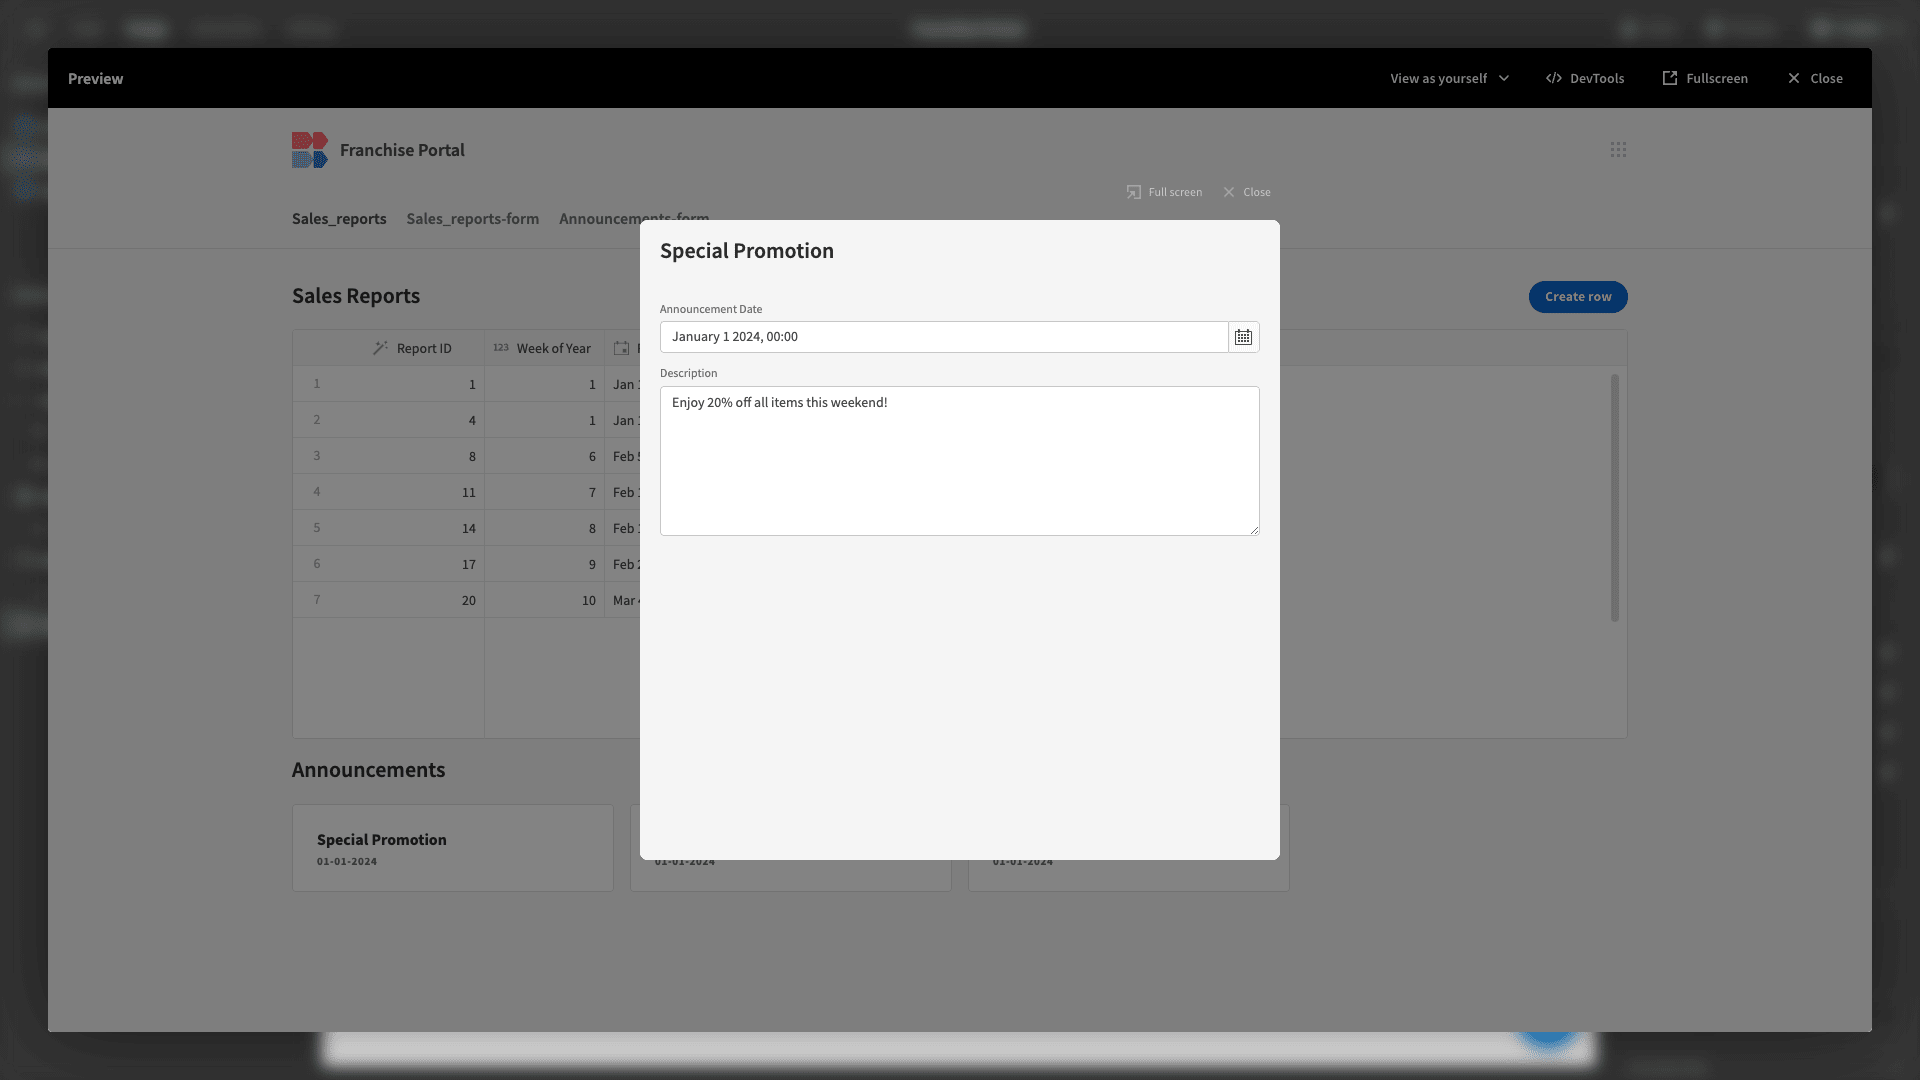
And that’s the external-facing portion of our franchise portal finished.
4. Generating admin screens
Now, we can move on to creating screens for our internal users to carry out admin actions.
We’ll start by hitting the plus icon to add some screens and selecting the option to use the Table layout with details panels again.
This time, however, we’re selecting all four of our database tables. This will create a dedicated CRUD screen for each one.
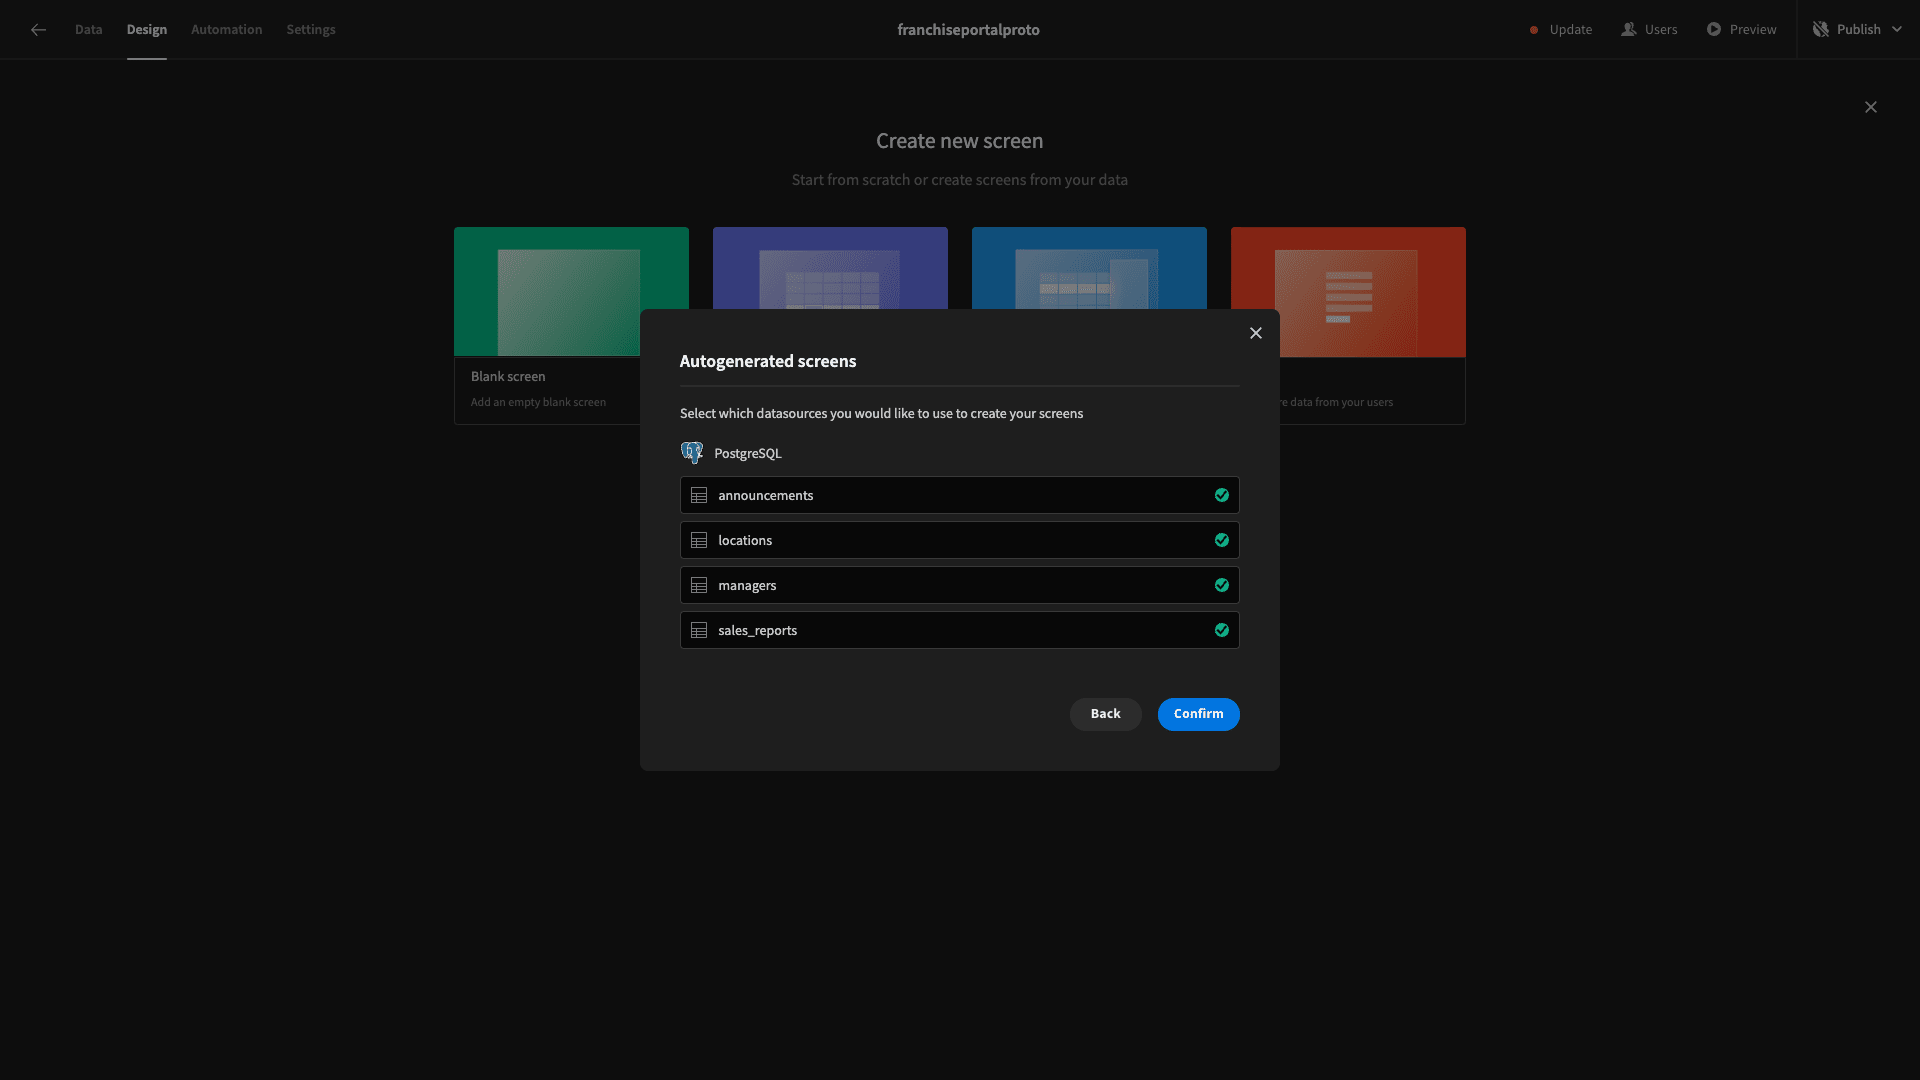
Then, we’ll set our minimum access level to Power.

We now have four new CRUD screens.

We’re going to make some slight changes to each of these to better suit our purposes.
Locations
For the locations table, we want to provide more or less full CRUD access, with the exception of our managers and sales_reports fields.
We’ll start by reducing the Table itself to a more easily scannable number of columns by deselecting address, postal_code, and location_id. We’ll also capitalize our title and column names.

Then, on each of our forms, we’ll simply deselect the managers and sales_reports fields and tidy up our display texts.

Announcements
For announcements, Power users will have full CRUD access. So, on this screen, all we’re going to do is provide more human-readable text.

And we’ll do the same within each of our forms.

Sales Reports
For our sales_reports table, internal users only need read access. So, we’ll start by deleting our Create Row button and the corresponding side panel.
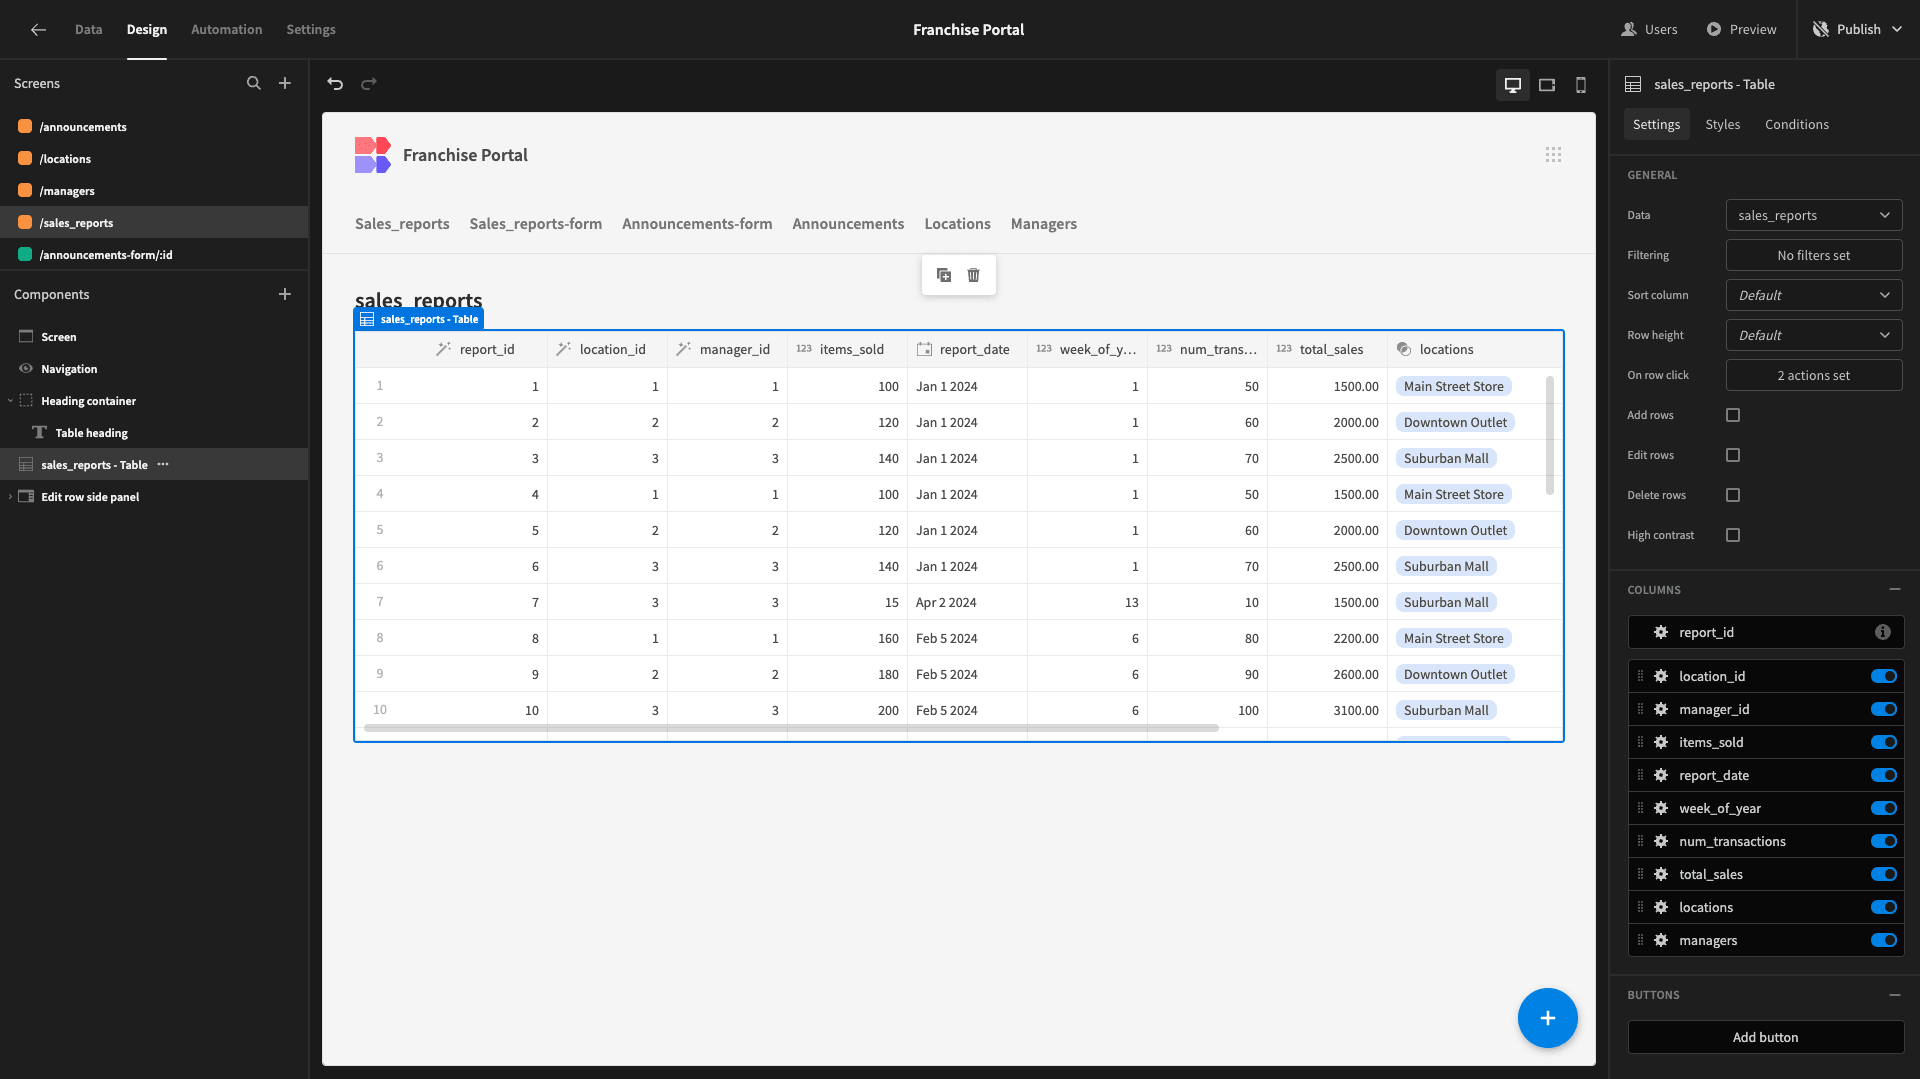
Then, we’ll deselect all of the table ID columns and edit our display texts.
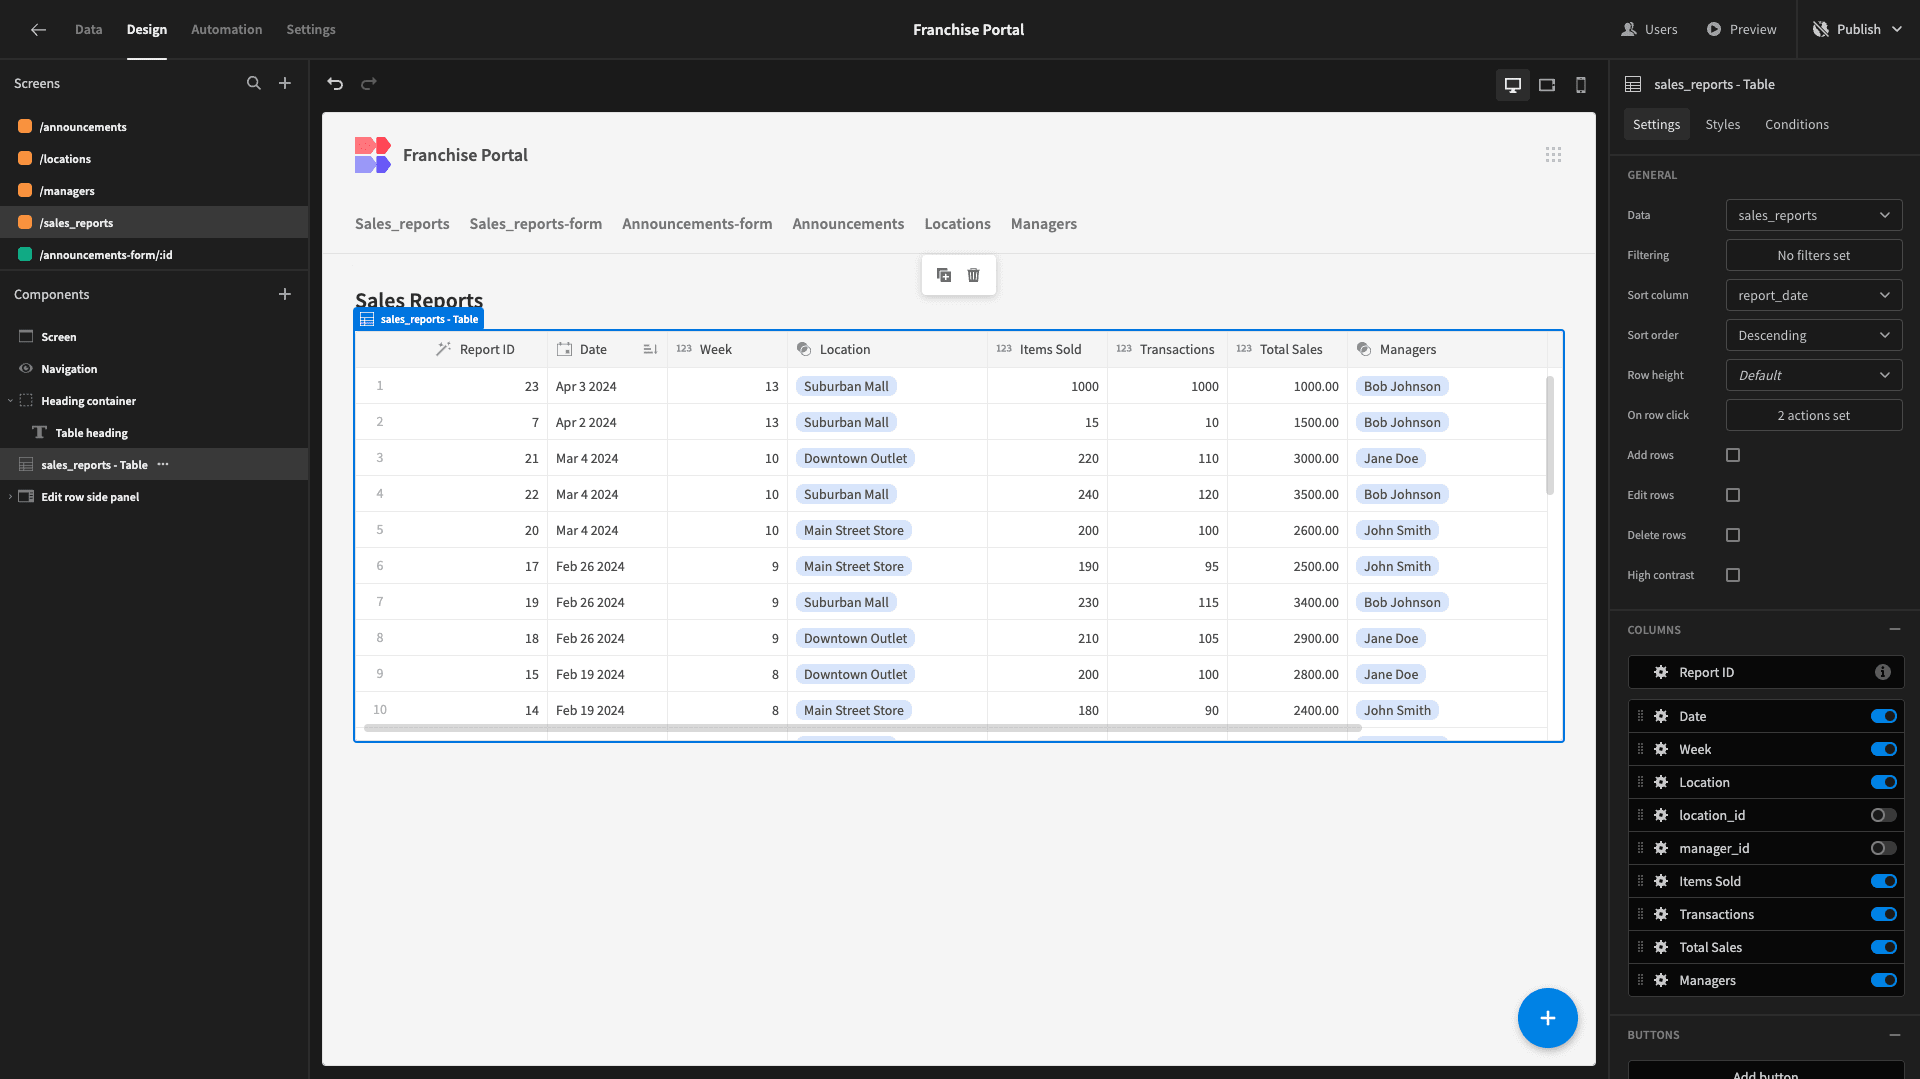
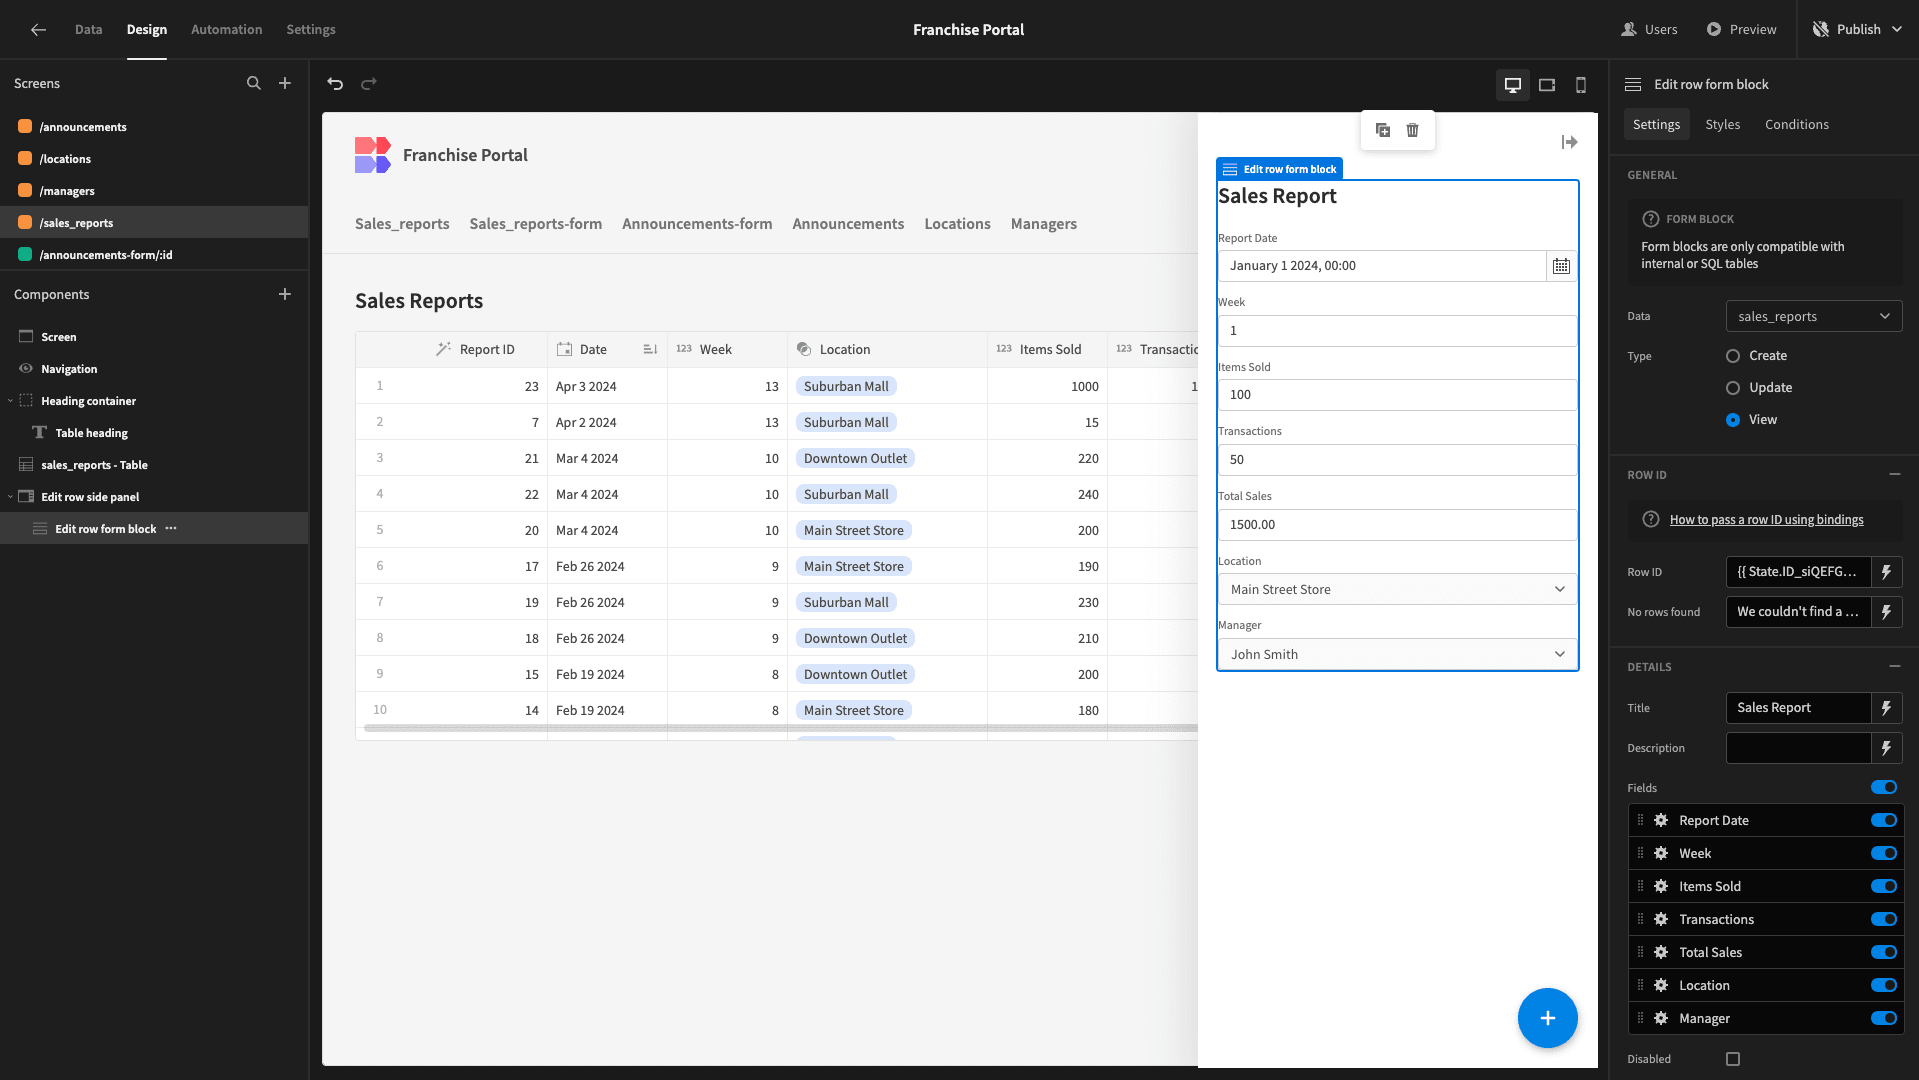
For our remaining form, we’ll set the Type to View and repeat the process of updating all of our display texts - including the title.
Managers
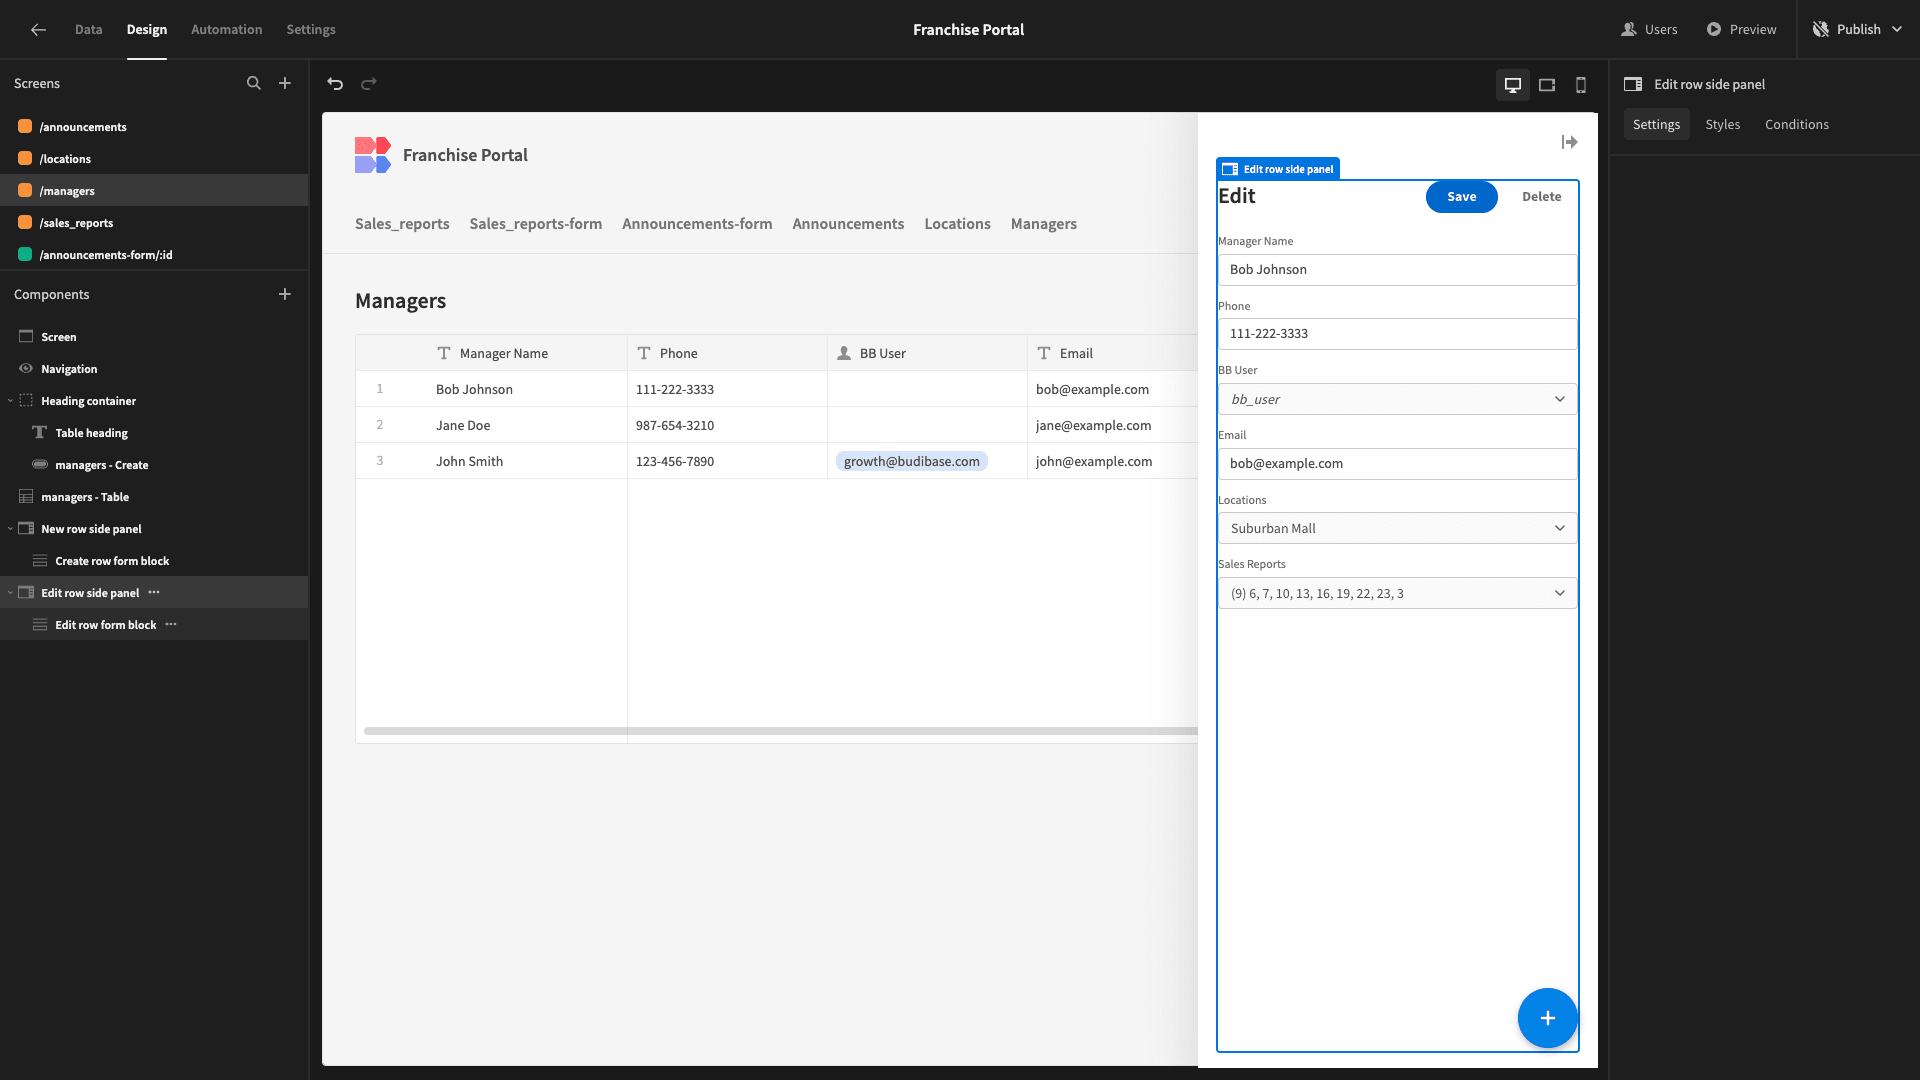
Lastly, we have the managers table. Again, we want to give Power users full CRUD access here, so we’re simply disabling the location_id and manager_id fields and then tidying up the display texts.
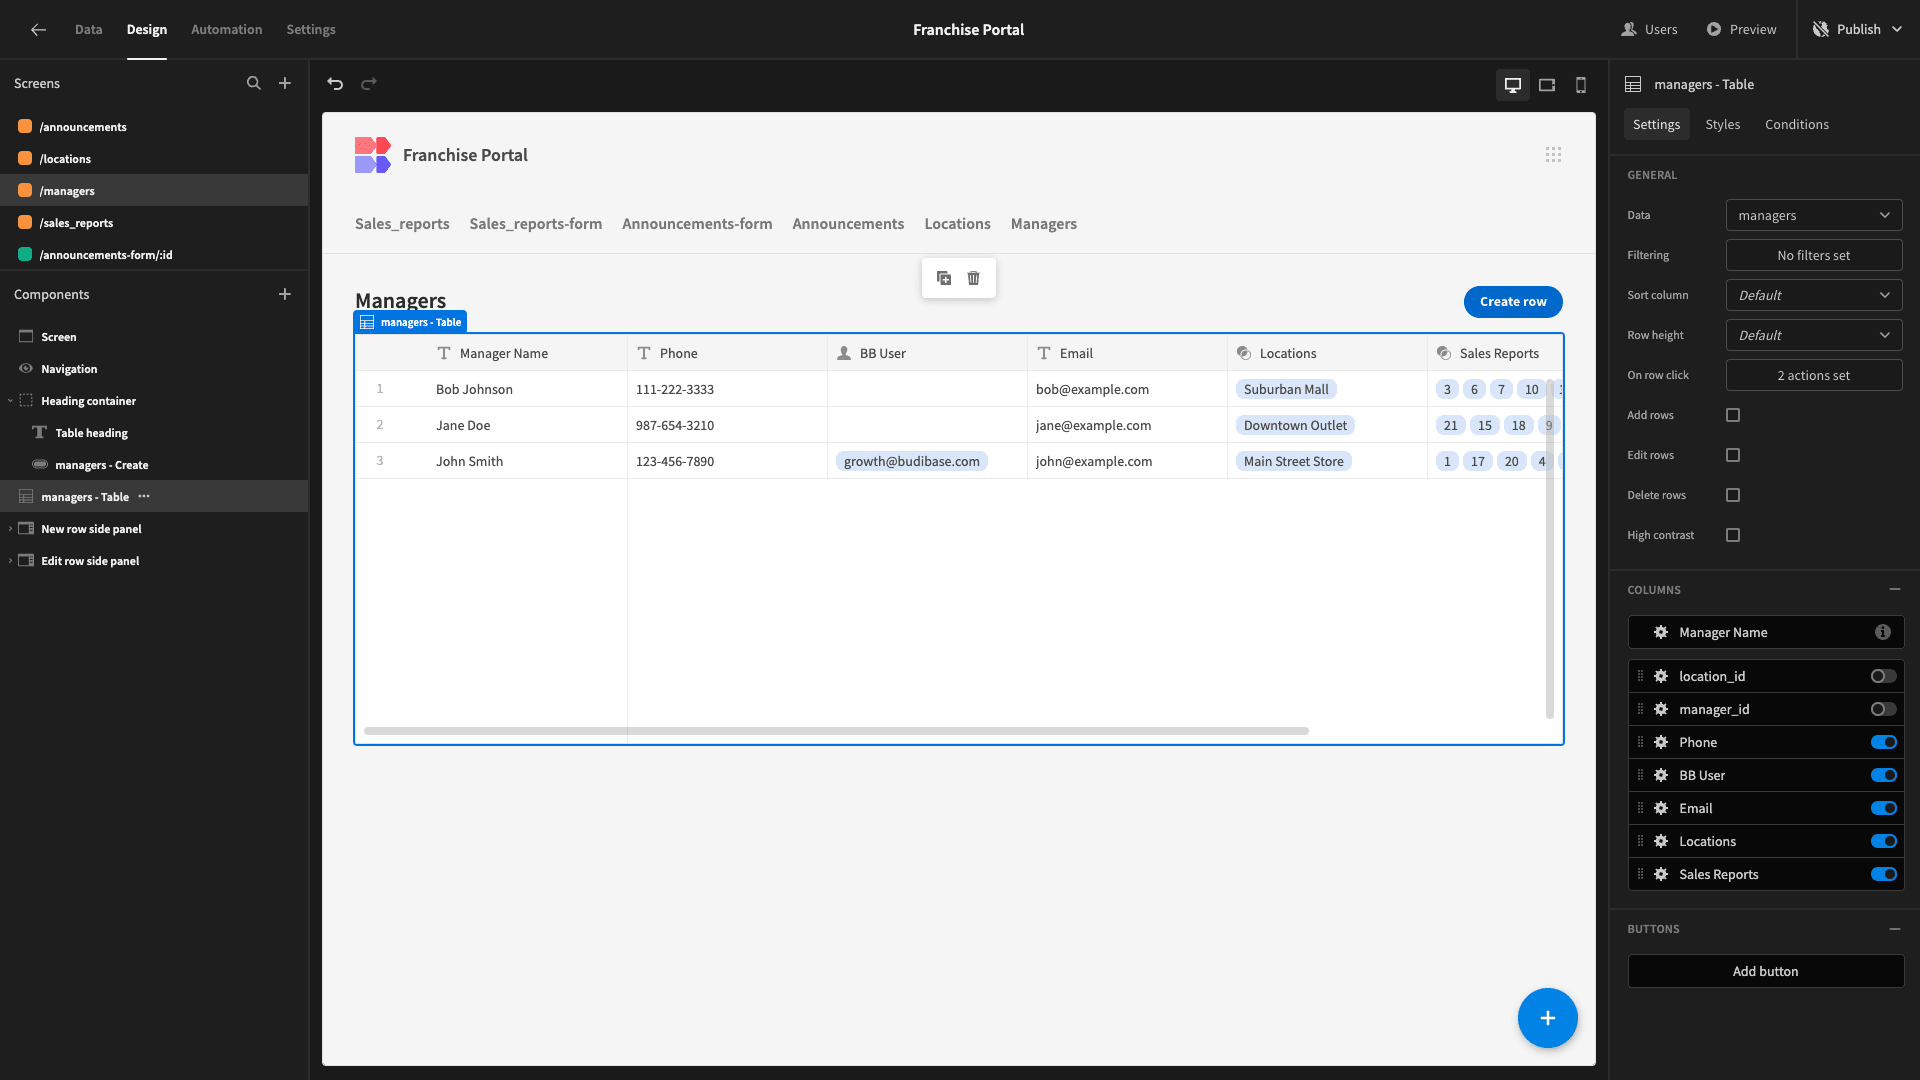
And again, we’ll do the exact same thing on each of our forms.
5. Adding a sales chart
Budibase also offers powerful functionality for visualizing external data. To demonstrate this, we’re going to add functionality for Power users to view weekly sales performance - both for individual franchises and across the business as a whole.
In addition to direct CRUD actions, Budibase supports custom queries to SQL databases. We’ll create a couple of these to extract the insights we need.
Under our Postgres connection in the Data section, we’ll hit Create New Query.

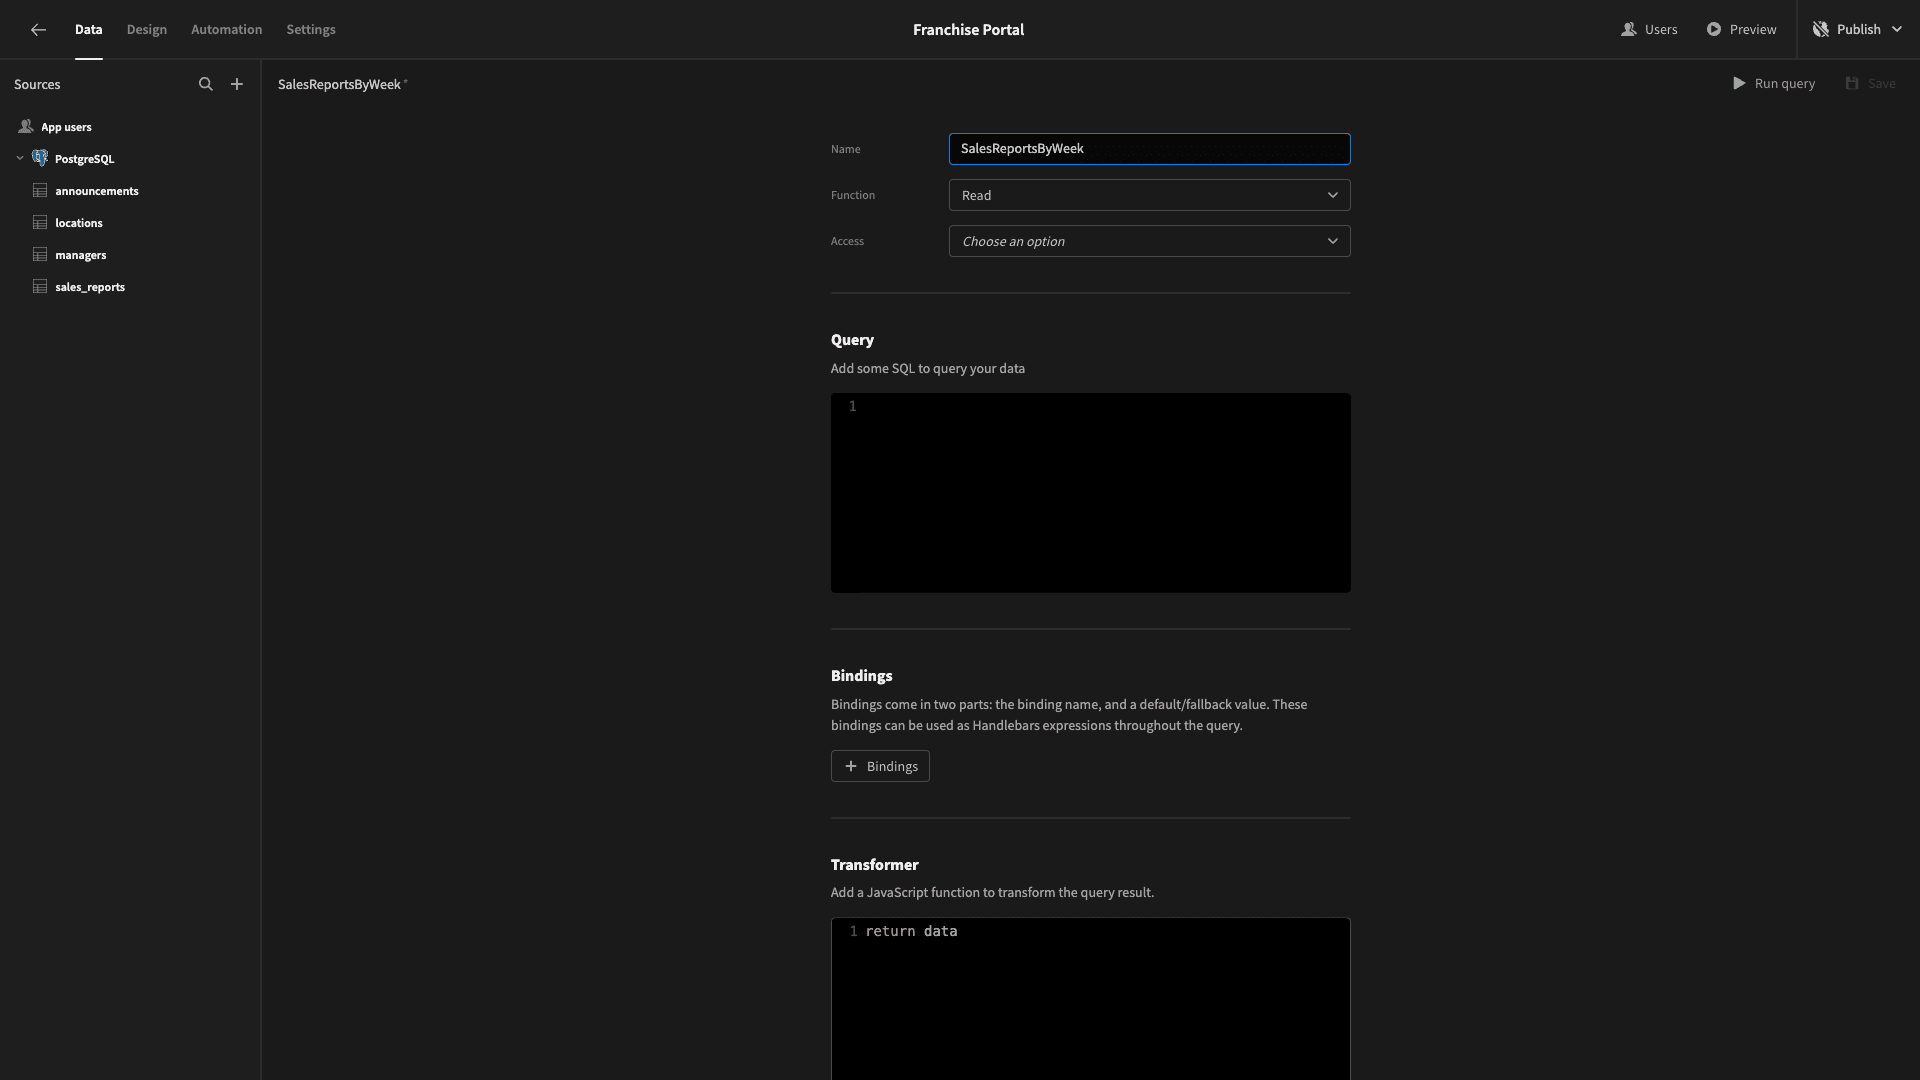
This opens an editor where we can give our query a name, select a function, and input our SQL commands.
We’ll call our first one SalesReportsByWeek.
We’ll first generate a time series to select all of the numerical weeks for the year so far.
Then, we’ll join this to a query returning the sum of all of the individual sales figures for each of those weeks from our sales_reports table. If no row exists for a given week, we’ll return 0 for each figure using the COALESCE command.
The returned data is grouped and ordered by the numerical week.
So, our query is:
1WITH Weeks AS (
2
3 SELECT generate_series(
4
5 date_trunc('year', CURRENT_DATE),
6
7 CURRENT_DATE,
8
9 '1 week'::interval
10
11 )::date AS week_start
12
13)
14
15SELECT
16
17 EXTRACT(WEEK FROM week_start) AS week_of_year,
18
19 COALESCE(SUM(total_sales), 0) AS total_sales,
20
21 COALESCE(SUM(num_transactions), 0) AS total_transactions,
22
23 COALESCE(SUM(items_sold), 0) AS total_items_sold
24
25FROM
26
27 Weeks
28
29LEFT JOIN
30
31 Sales_Reports ON EXTRACT(WEEK FROM Sales_Reports.report_date) = EXTRACT(WEEK FROM week_start)
32
33GROUP BY
34
35 week_of_year, week_start
36
37ORDER BY
38
39 week_of_year;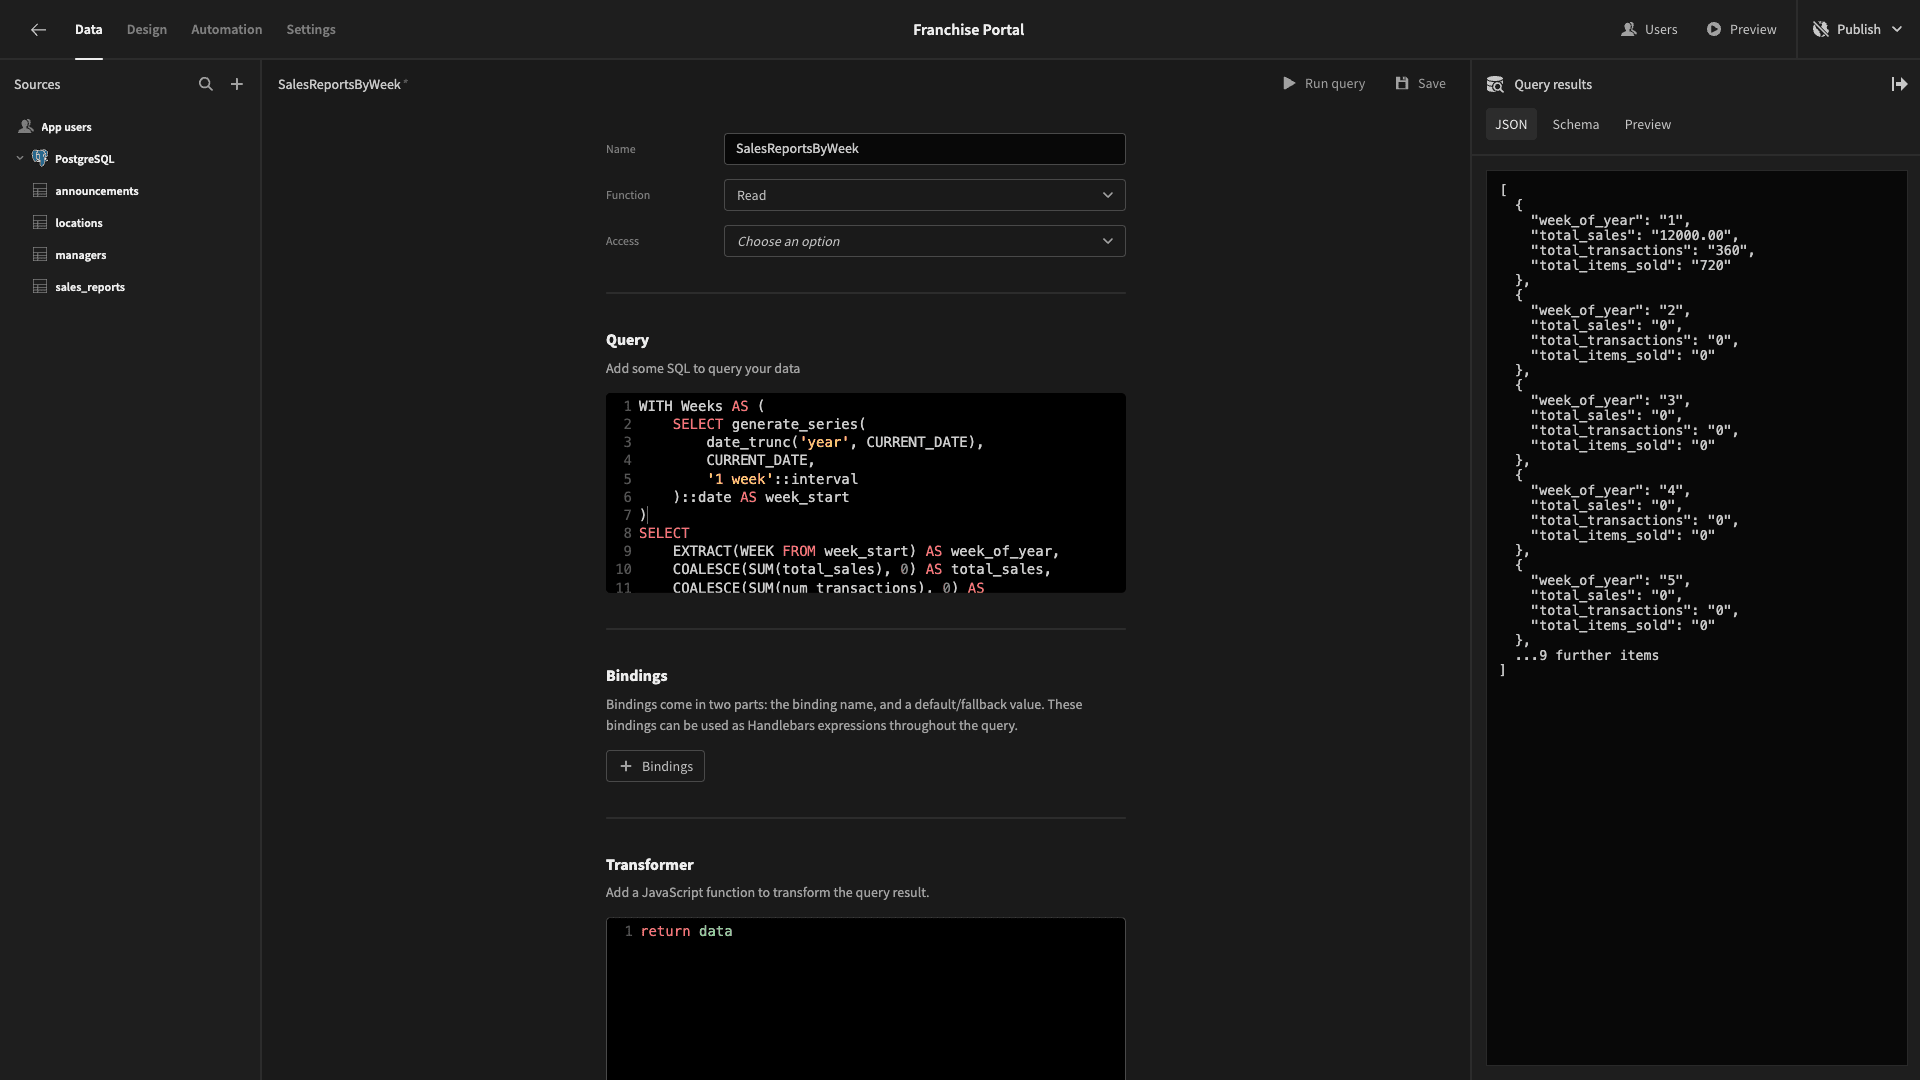
Then, we’ll create a second query called SalesReportsByWeekByLocation. This will work the same way, but it will also group the returned data by the location_name attribute from the sales_reports table.
1WITH Weeks AS (
2
3 SELECT generate_series(
4
5 date_trunc('year', CURRENT_DATE),
6
7 CURRENT_DATE,
8
9 '1 week'::interval
10
11 )::date AS week_start
12
13)
14
15SELECT
16
17 Locations.location_name,
18
19 EXTRACT(WEEK FROM week_start) AS week_of_year,
20
21 COALESCE(SUM(total_sales), 0) AS total_sales,
22
23 COALESCE(SUM(num_transactions), 0) AS total_transactions,
24
25 COALESCE(SUM(items_sold), 0) AS total_items_sold
26
27FROM
28
29 Weeks
30
31CROSS JOIN
32
33 Locations
34
35LEFT JOIN
36
37 Managers ON Locations.location_id = Managers.location_id
38
39LEFT JOIN
40
41 Sales_Reports ON Managers.manager_id = Sales_Reports.manager_id
42
43 AND EXTRACT(WEEK FROM Sales_Reports.report_date) = EXTRACT(WEEK FROM week_start)
44
45GROUP BY
46
47 Locations.location_name, week_of_year, week_start
48
49ORDER BY
50
51 Locations.location_name, week_of_year;
Now, let’s head back to the Design section and select the /locations screen.
At the bottom of the screen, we’re going to add a Form component. This will allow us to interactively filter the chart that we’re going to create in a second.
Inside the form, we’ll add a horizontal container.
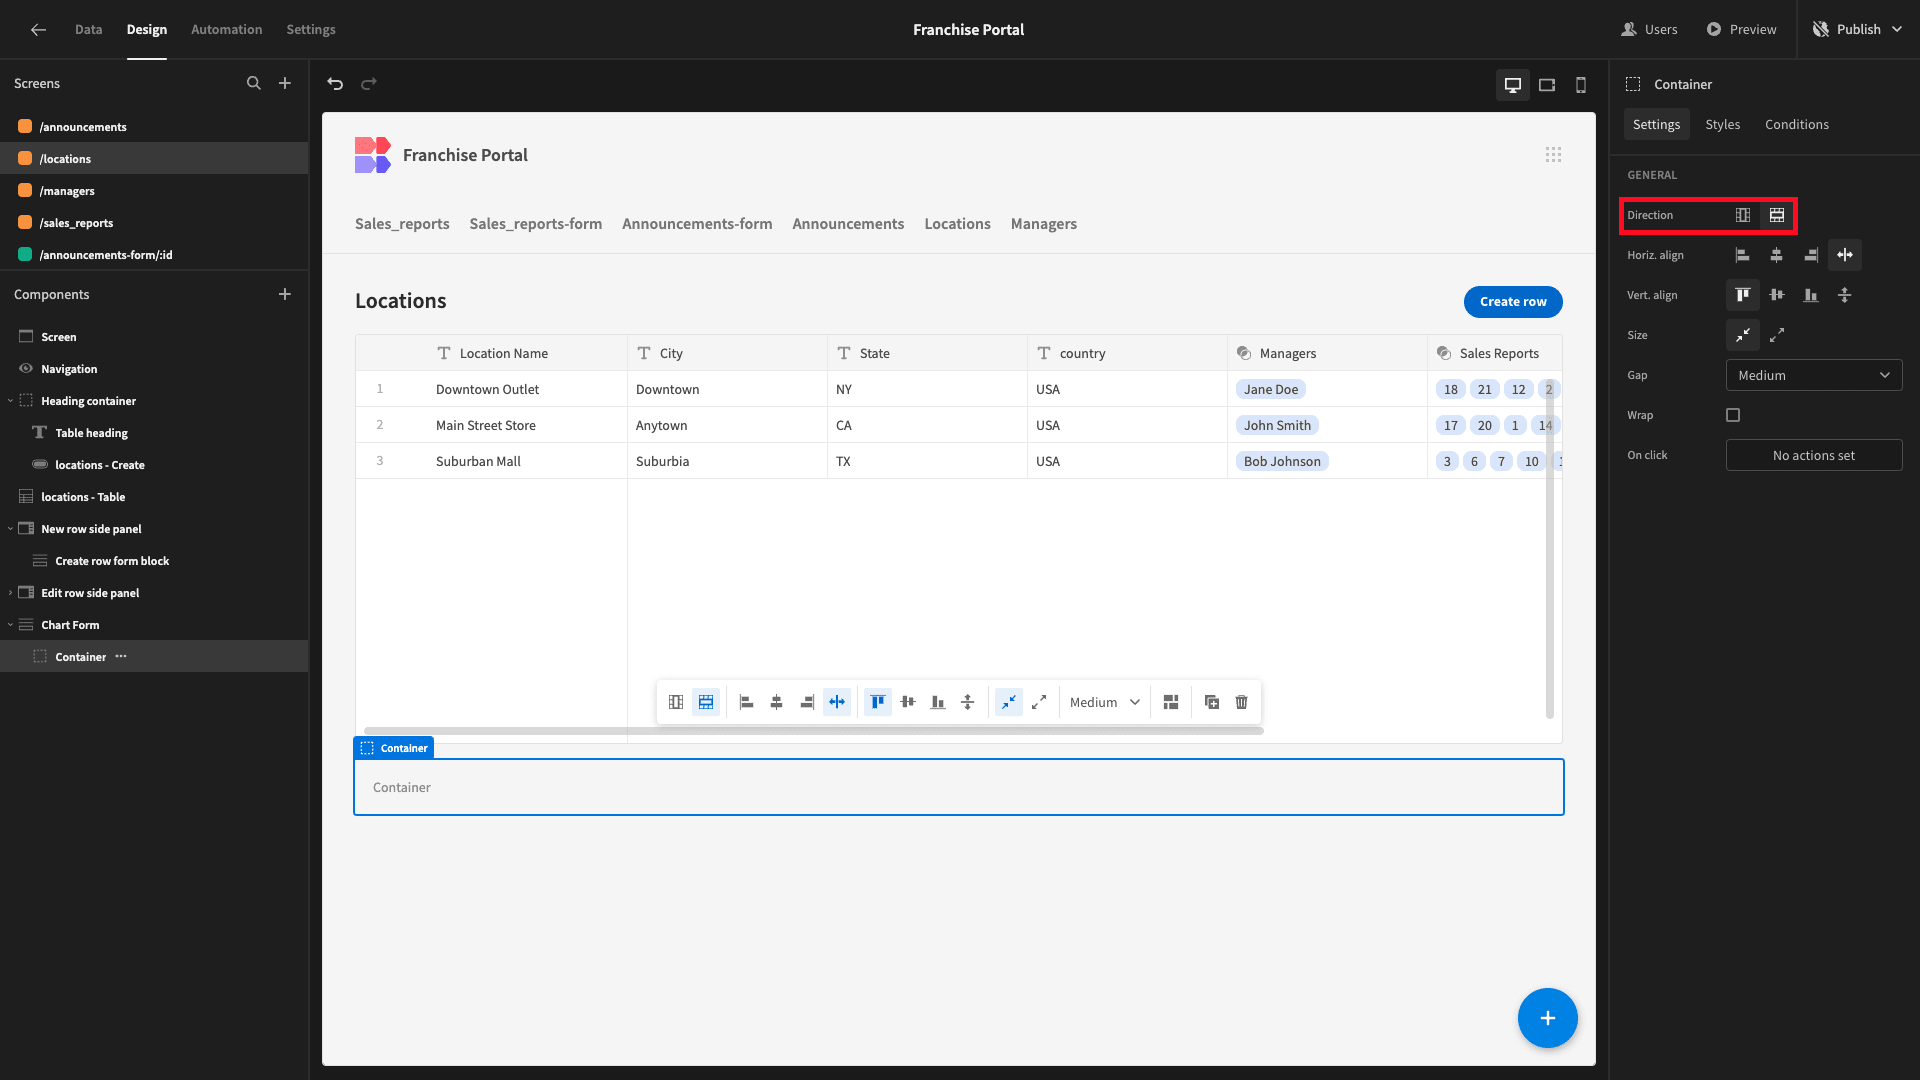
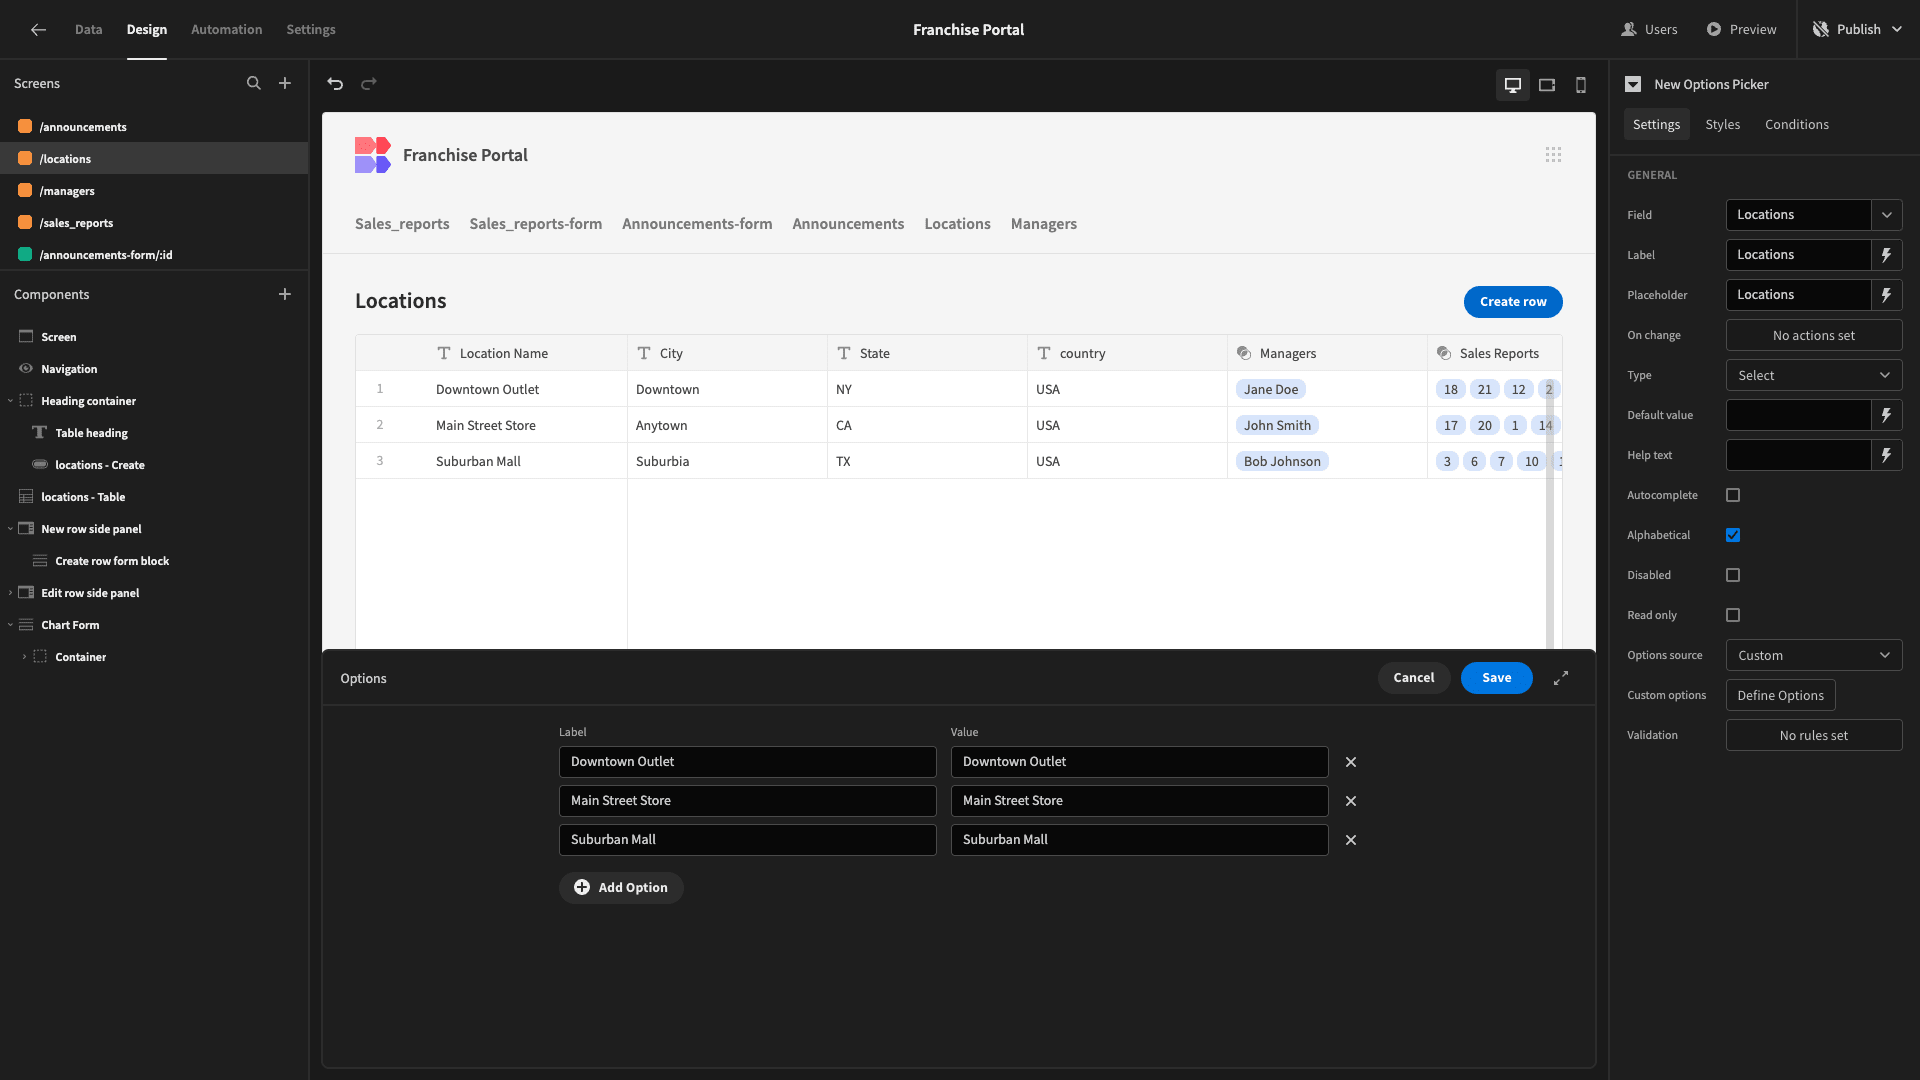
Within this, we’ll place a Headline component and an Options Picker. We’ll populate the headline and set the Field, Label, and Placeholder for our Options Picker to Locations.

Then, we’ll set the Options Source to Custom and hit Define Options.

Here, we’ll add the possible location_names from our database table as options.
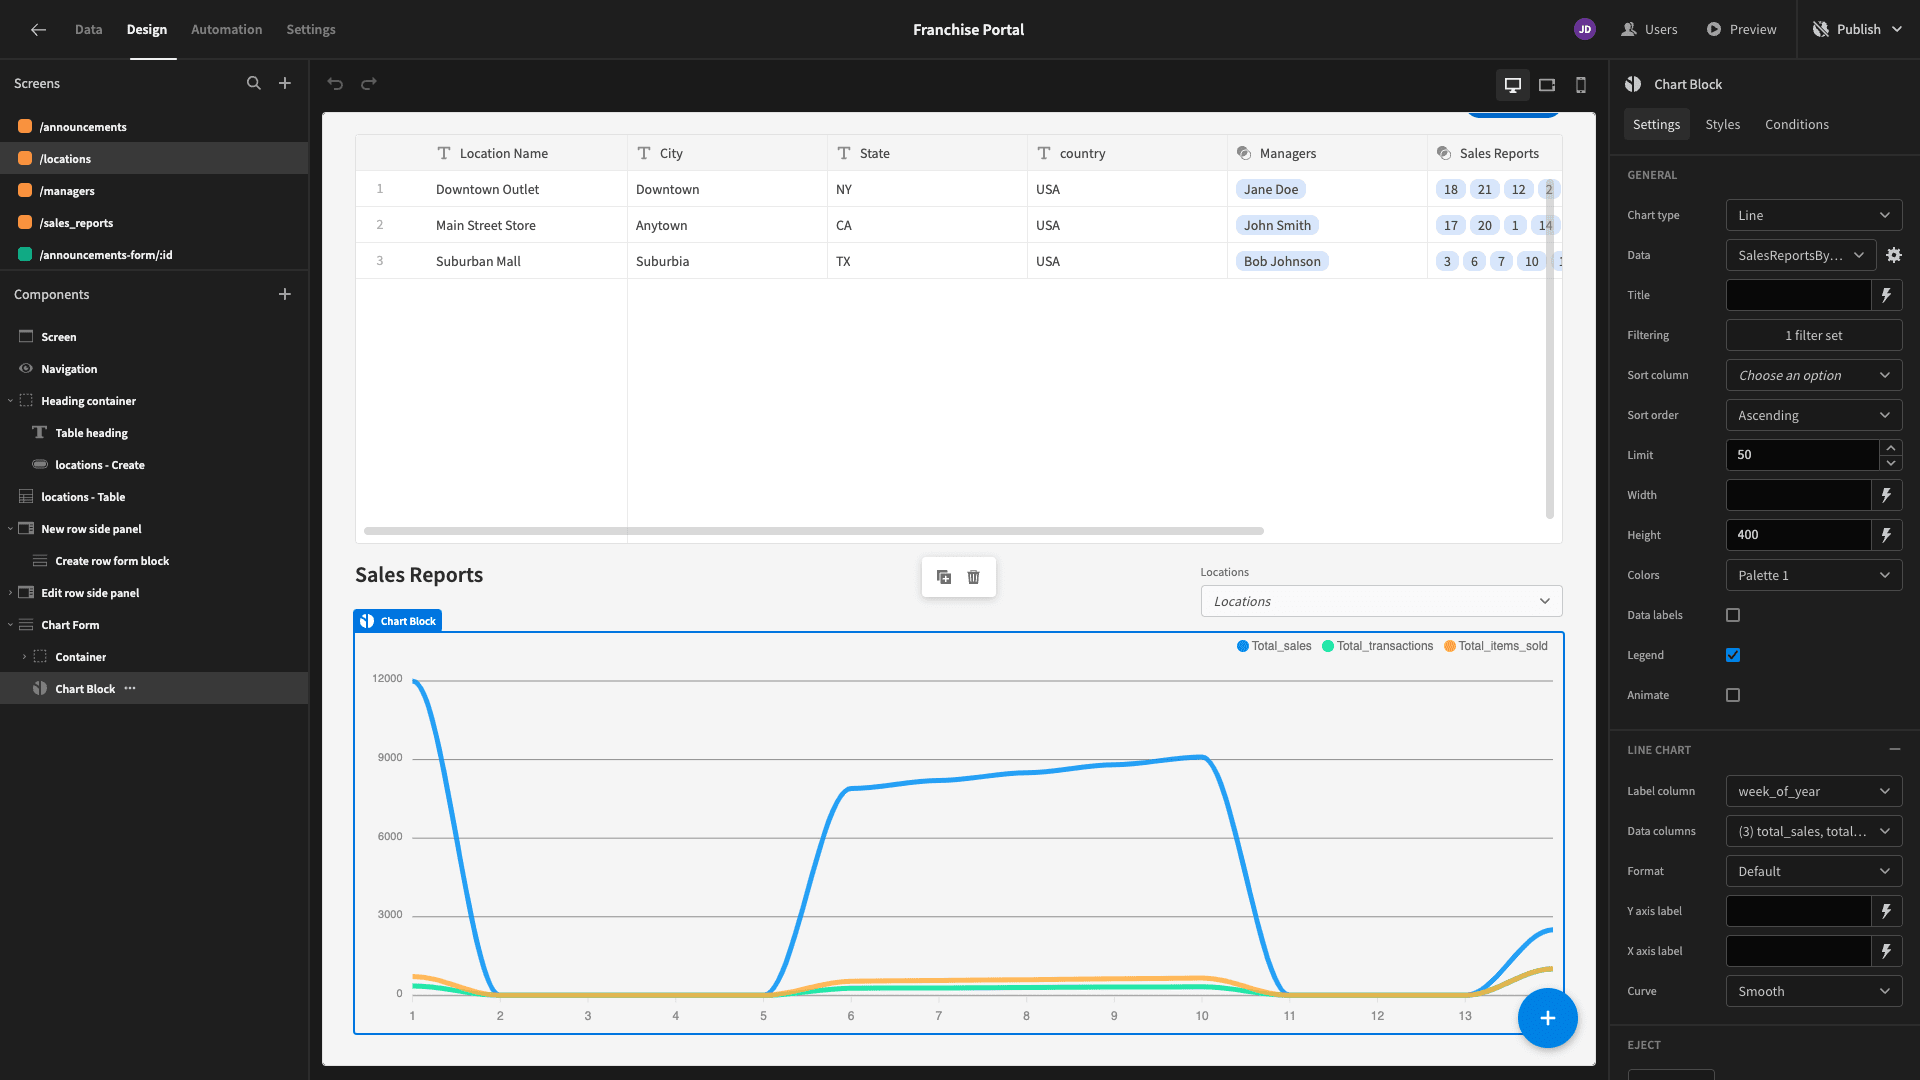
Next, we’ll add a Chart Block component beneath our container, setting its Data to our SalesReportsByWeekByLocation query and choosing Line as its Type.

We’ll set the Label Column to the week_of_year attribute from our response and the Data Columns to total_sales, total_transactions, and total_items_sold.
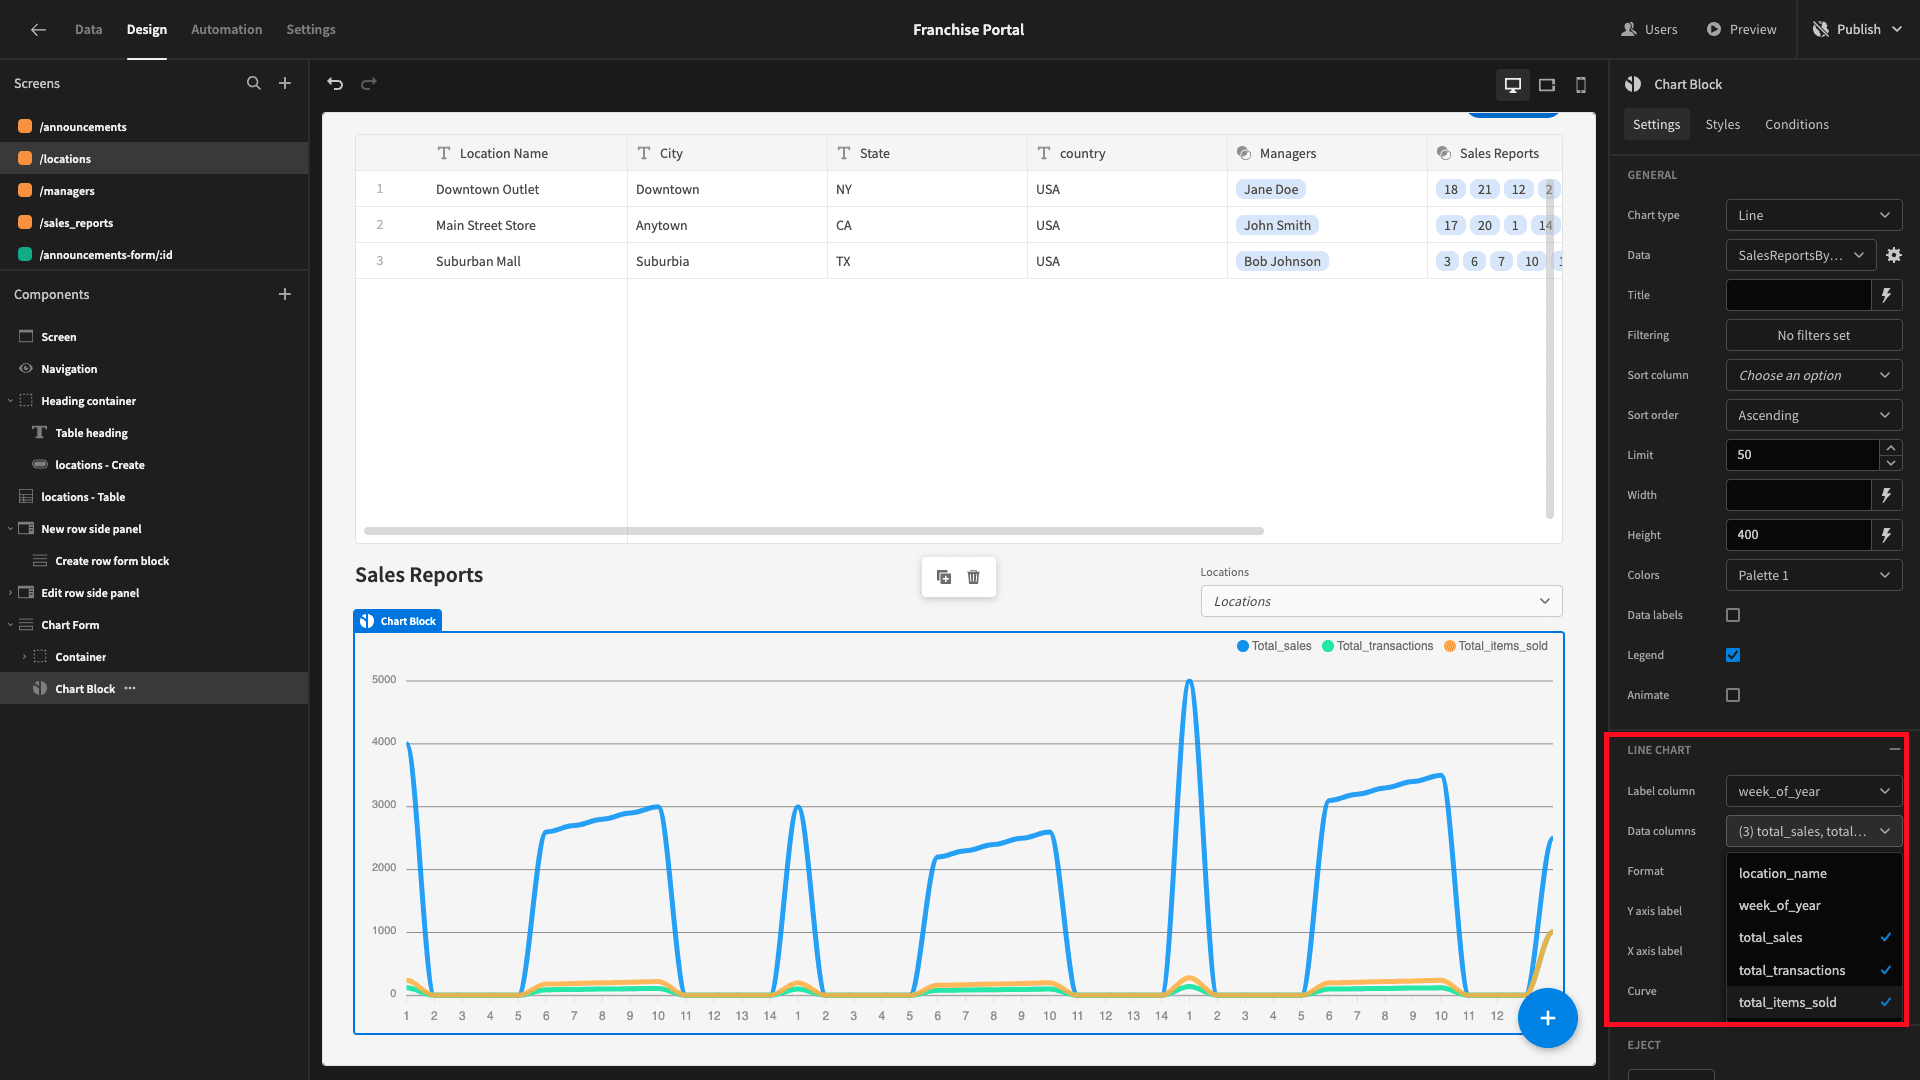
However, at present, there are three notches on the X-axis for each numerical week - because our query is also grouped by location_name. We’ll add a filter to our Chart Block so that only one is displayed at a time.
Specifically, we’ll create a rule so that location_name is equal to {{ Chart Form.Fields.Locations }}. That is the value that’s currently selected in our Options Picker.

Now, if we select a specific location, our chart displays the correctly formatted data.

When the Options Picker is empty, we want to use our chart to visualize our other query, where the data is not grouped by location.
We can achieve this using Budibase’s custom conditionality rules. These enable us to define conditions for hiding and displaying components, as well as updating any of their native options.
We’ll start by opening the Conditionality Drawer and adding an Update Setting rule.

We’ll update the chart’s Data to SalesReportsByWeek.
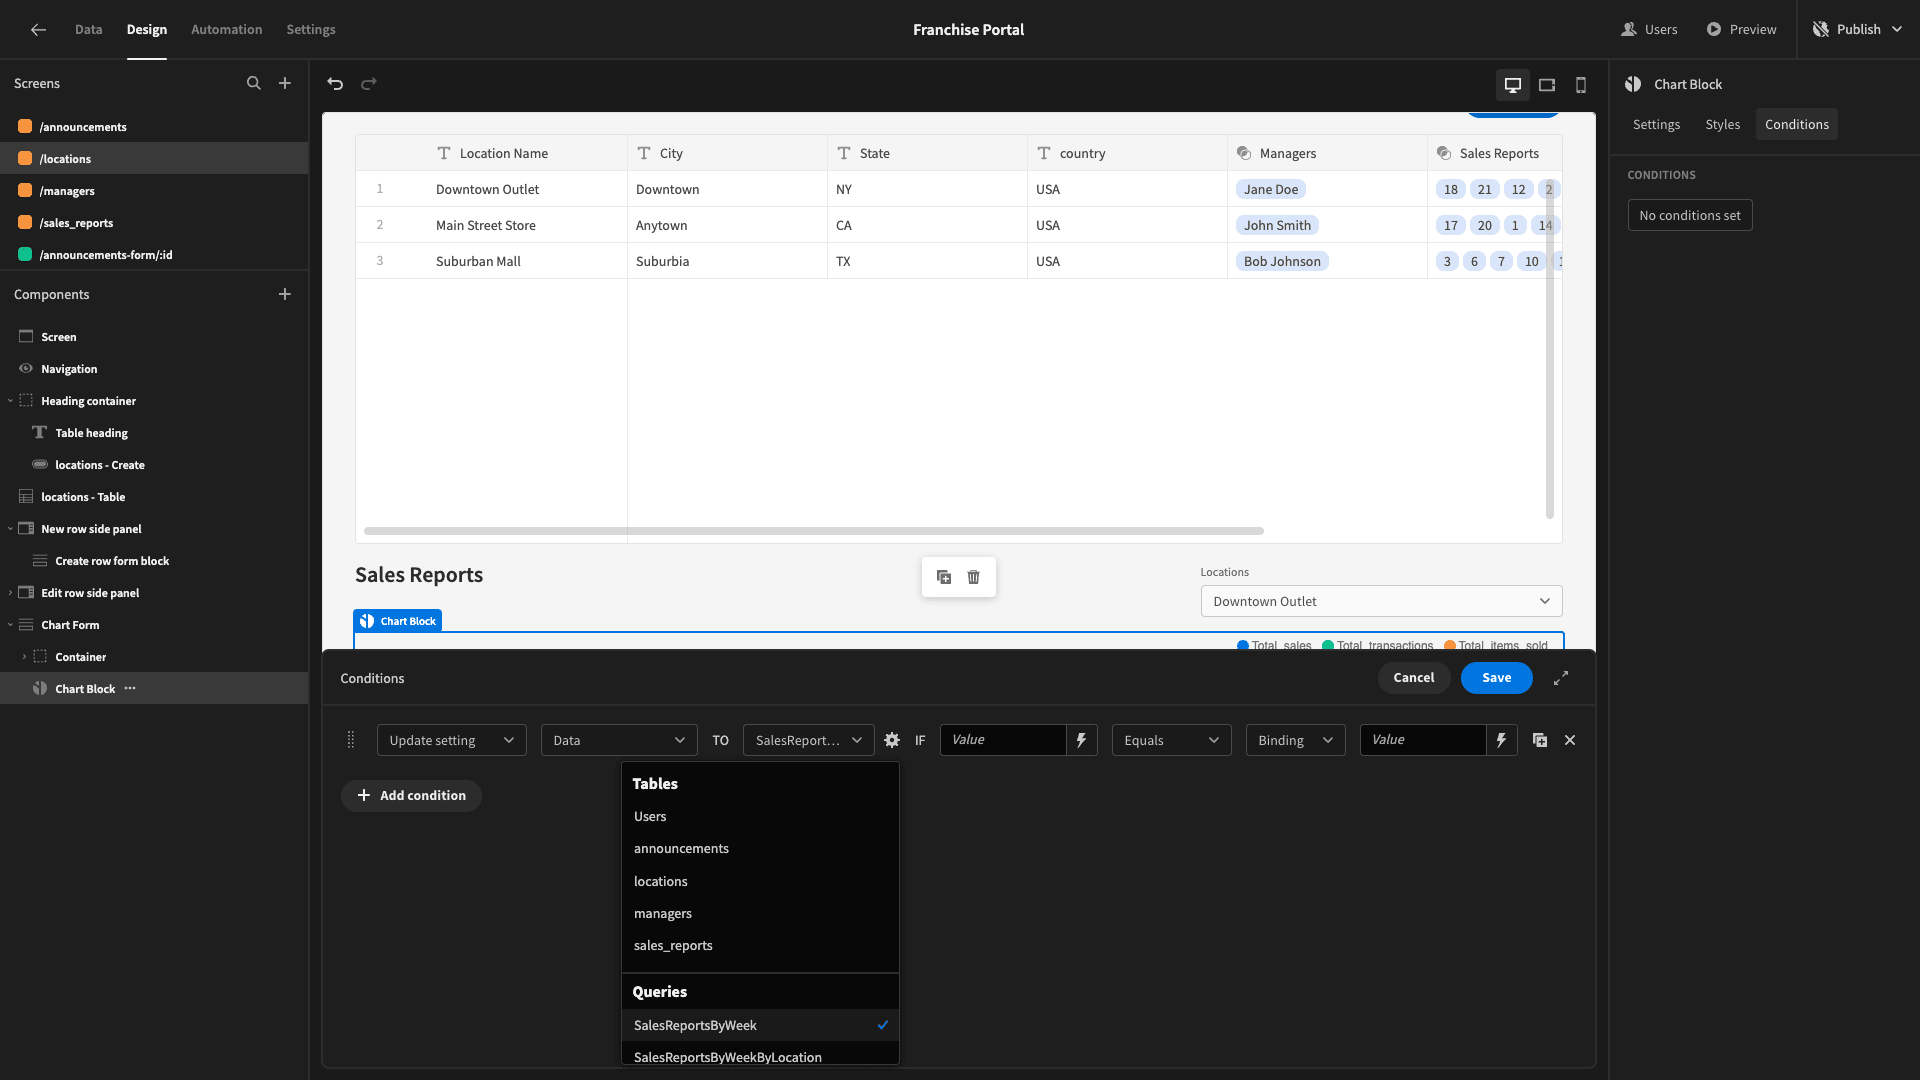
If {{ Chart Form.Fields.Locations }} is empty.

Here’s how this will look.
6. Design tweaks and publishing
Now, our franchise portal is almost ready to go. However, before we push it live for users, we’re going to make a few final design tweaks.
First, our navigation bar has become a little bit cluttered with an entry for each screen. Under Navigation, we’ll hit Configure Links to tidy this up.
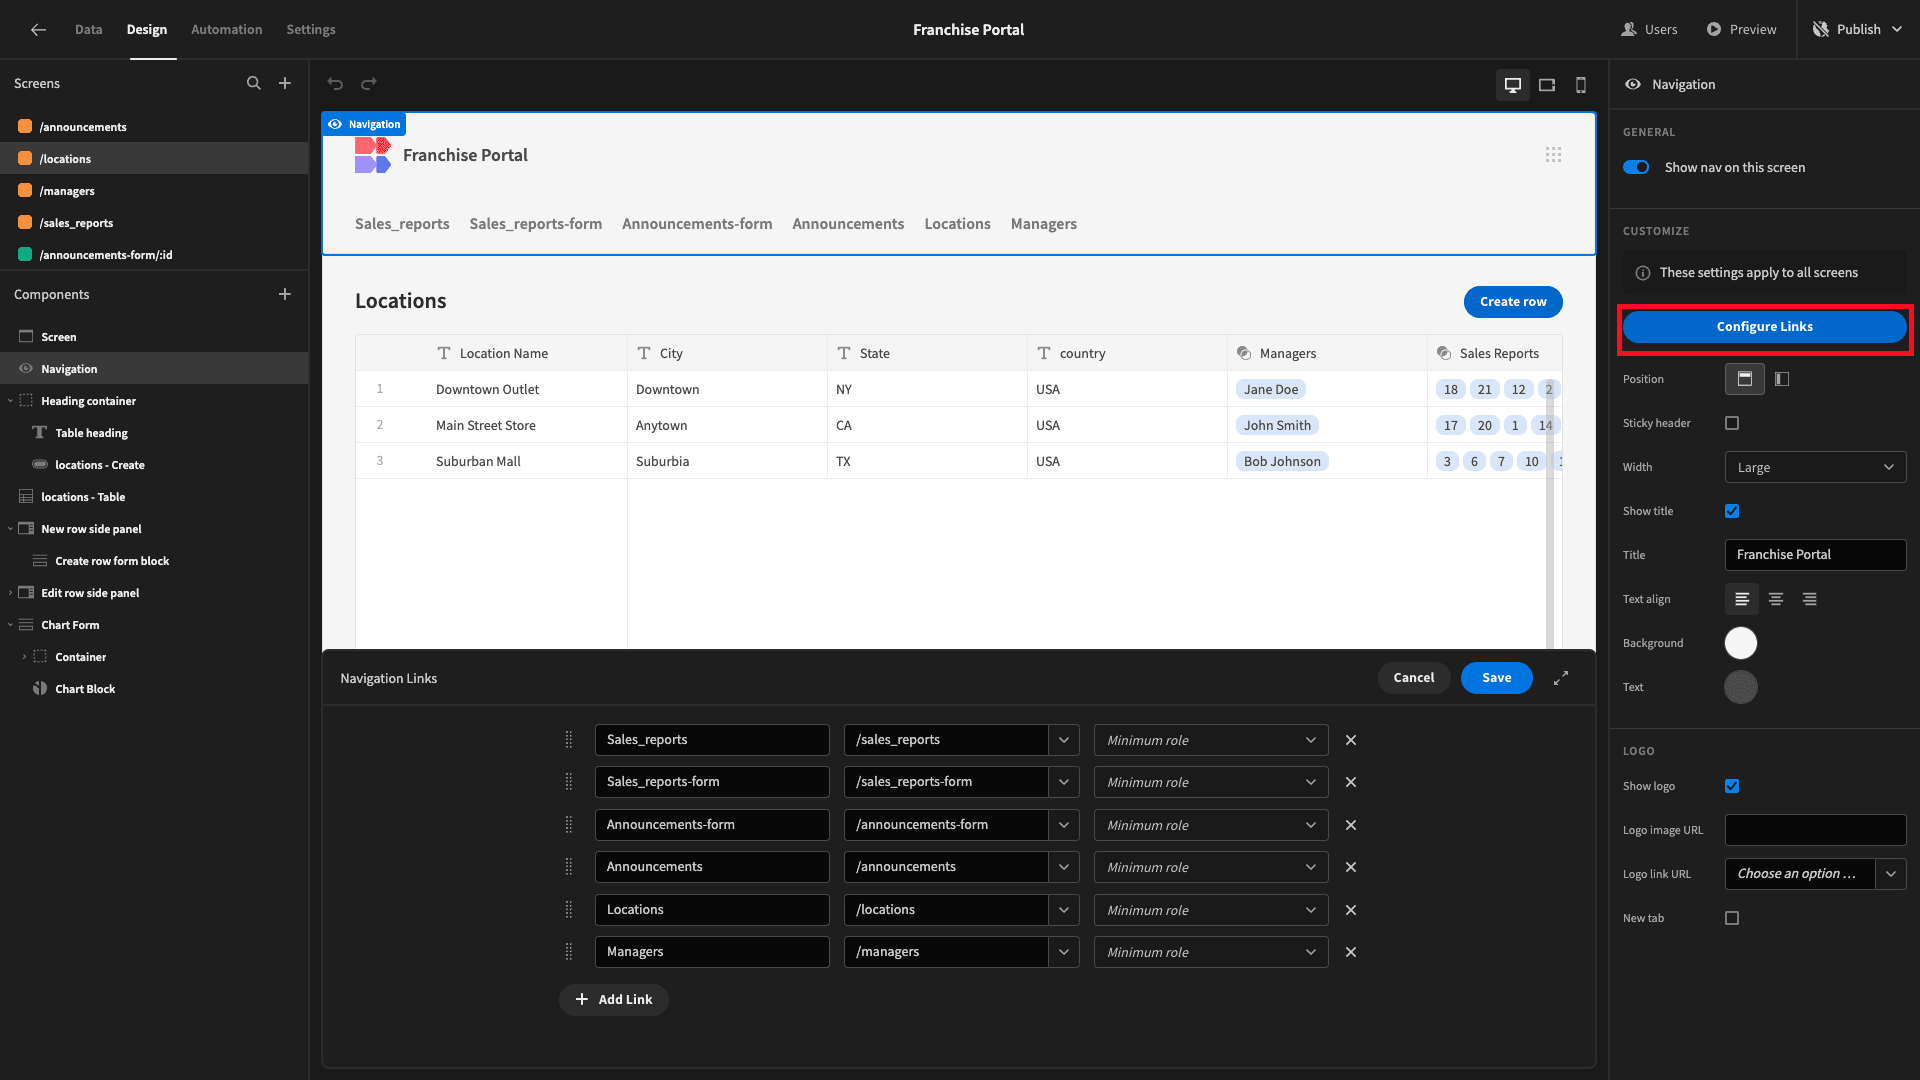
First, we’ll remove our two form screens. Then, we’ll set the minimum role for our remaining menu items to Power. That way, Basic users won’t be able to see them - since they should only be able to access a single screen anyway.

Next, on the /locations screen and the Basic version of /sales-reports, we’ll select the Set as Home Screen option.

Here’s how our franchise portal will look when Basic users load it.

But, for Power users, it will look like this.
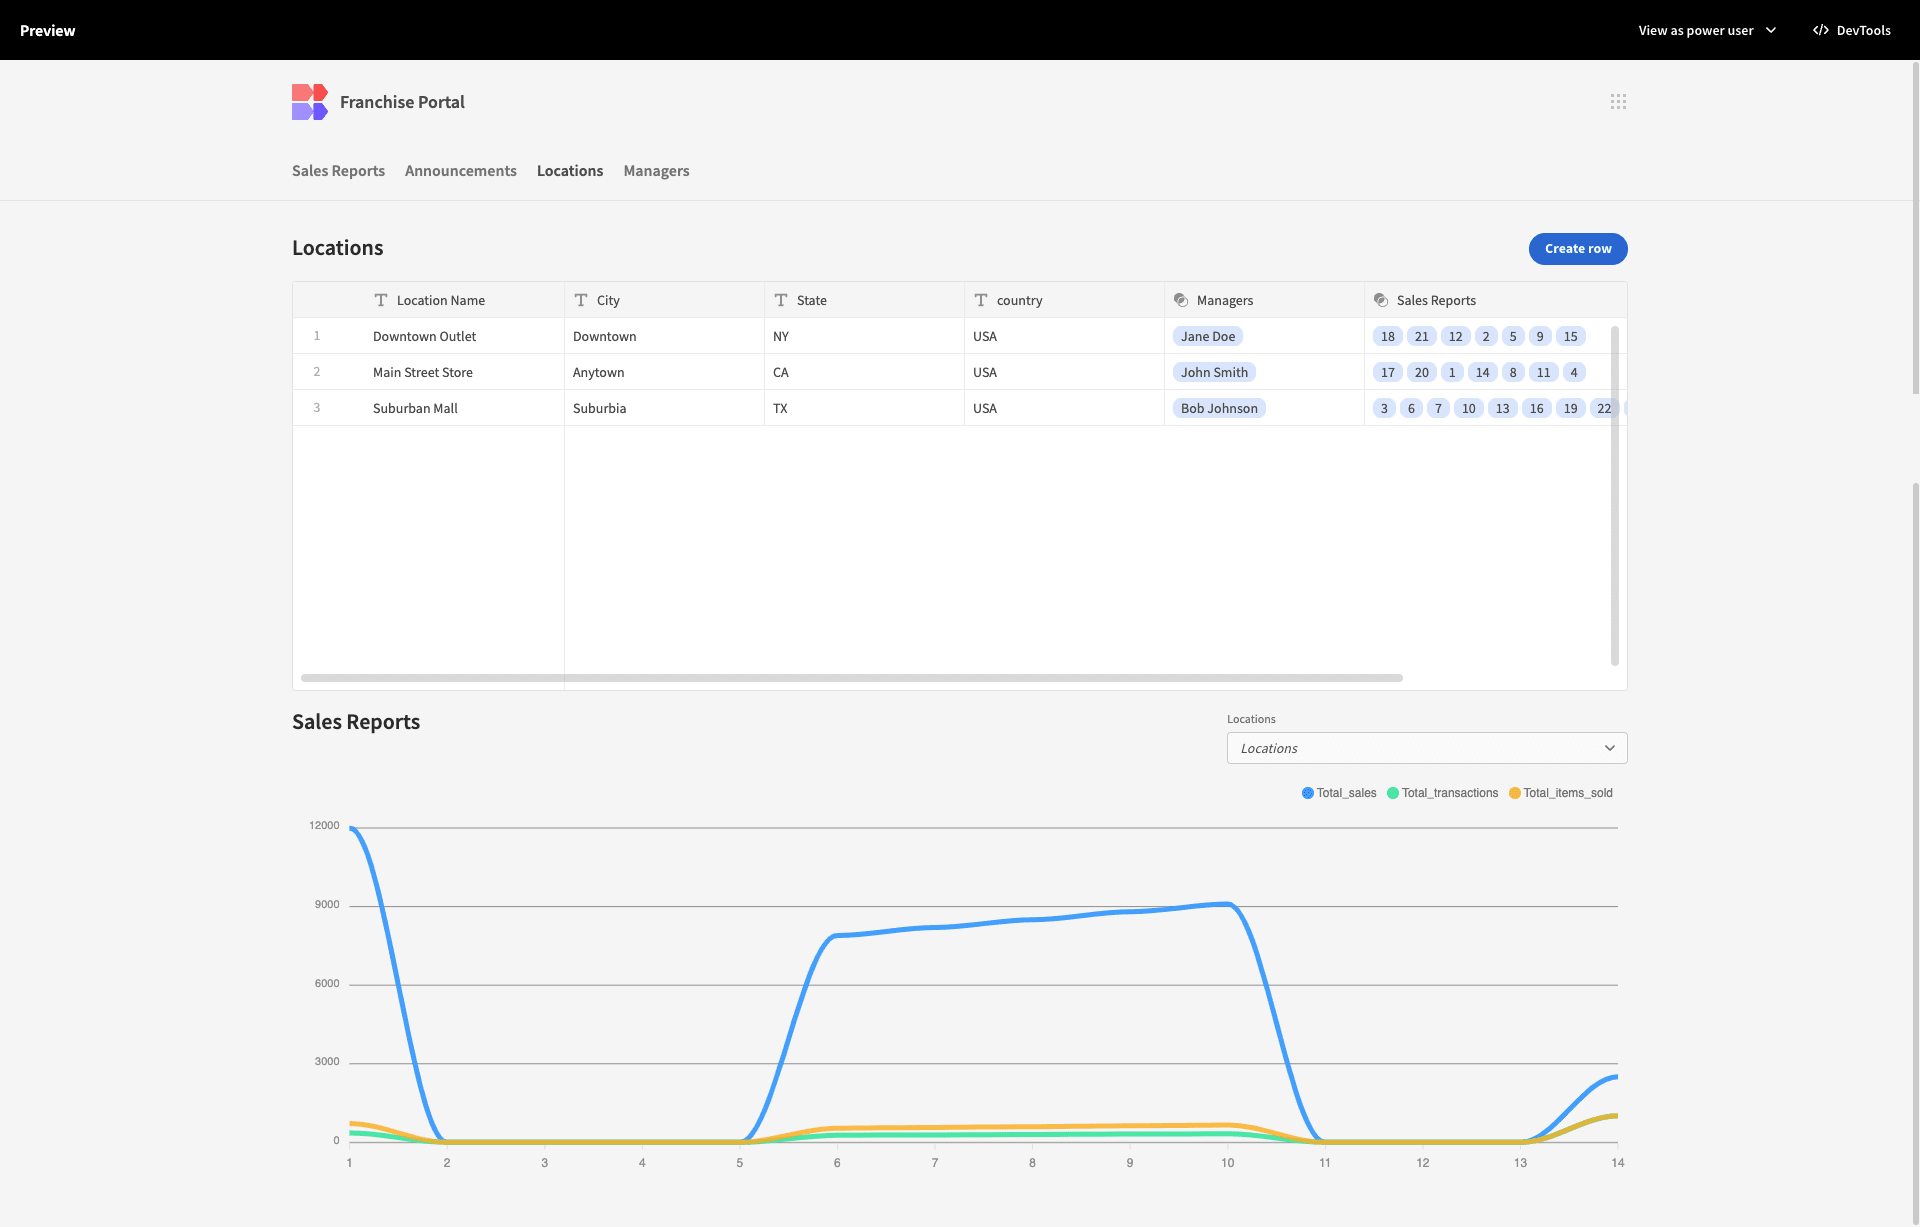
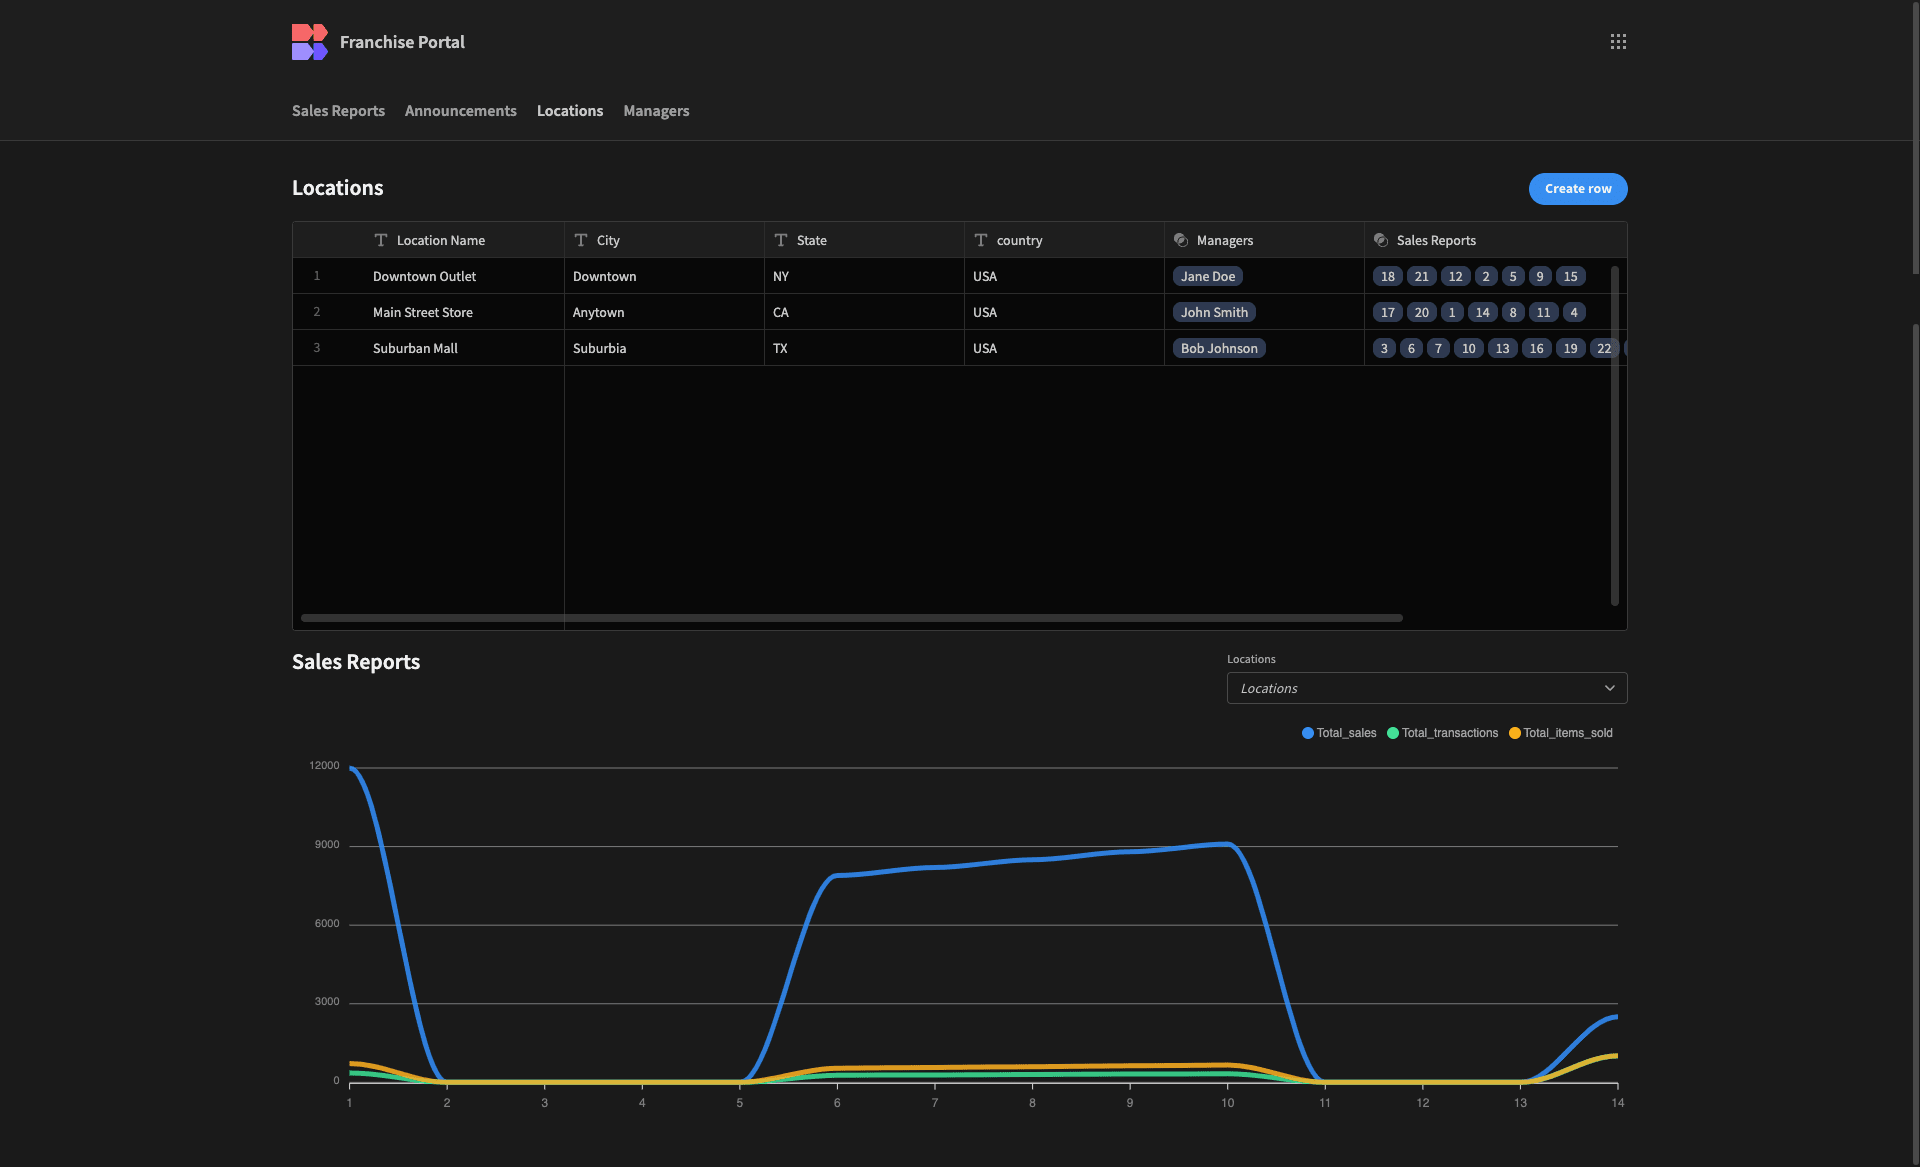
Lastly, under Screen, we’re going to set our Theme to Darkest.

When we’re ready to push our app live, we’ll hit Publish.

Here’s a reminder of what our finished franchise portal will look like.
Budibase is the fast, easy way to build secure portals on top of just about any data. To learn more, check out our portal development page.